
 Products
Products
Products







I. Experimental Scenario: Microglia Observation
1.1 Astrocytes
Astrocytes are the most abundant and functionally complex glial cells in the central nervous system (CNS). They not only provide structural support and nutritional supply for neurons, but also actively maintain nervous system homeostasis, regulate synaptic function, and participate in immune responses. The typical stellate morphology of astrocytes relies on the integrity and dynamic changes of the cytoskeleton, mainly composed of F-actin microfilaments. Cytoskeleton rearrangement directly determines cell morphology, migration, phagocytosis and other core functions.
Under pathological conditions such as neurodegenerative diseases (Alzheimer’s disease, Parkinson’s disease) and epilepsy, astrocytes transform into a reactive state with significant cytoskeleton reconstruction, manifested as hypertrophy and proliferation. Such changes profoundly alter cell functions and are closely correlated with disease progression. Therefore, investigating the effects of different drug treatments on the astrocyte cytoskeleton is of great value for elucidating the mechanisms of neurological diseases and screening potential therapeutic drugs.
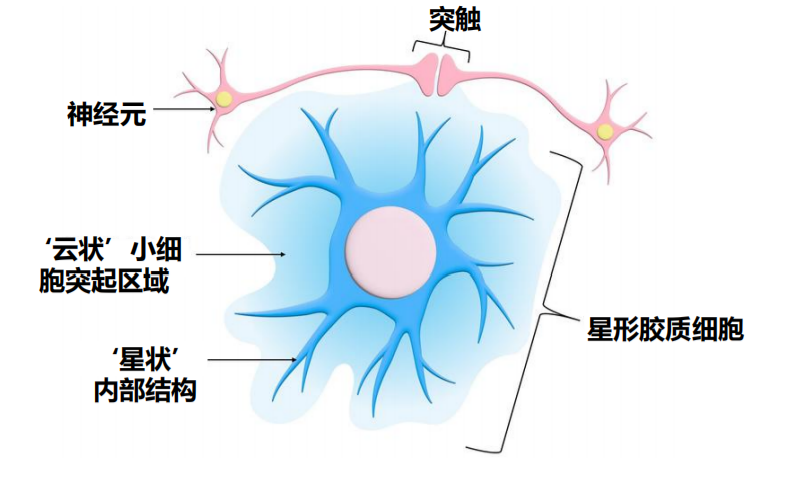
Figure 1 | Astrocytes
1.2 Application of Confocal Microscopy in Astrocyte Research
1.2.1 Mechanisms of Neurodegenerative Diseases
Research on the activation of astrocytes into harmful A1 subtype or beneficial A2 subtype in Alzheimer’s disease (AD), Parkinson’s disease (PD) and other disorders, as well as their impacts on neuronal survival and synaptic function.
Through immunofluorescence technology, reactive astrocytes with enhanced GFAP staining around pathological proteins (such as Aβ plaques) can be precisely localized, and their morphological changes can be quantitatively analyzed.
1.2.2 Stroke and Acute Brain Injury
Explore the involvement of astrocytes in inflammatory responses and glial scar formation after ischemia, hypoxia or trauma, and study the regulatory methods to promote their transformation into neuroprotective phenotypes.
Perform live-cell dynamic imaging to observe the propagation of calcium signals after injury; conduct 3D reconstruction of glial scar spatial structure to evaluate its physical barrier effect on axon regeneration.
1.2.3 Drug Screening and Safety Evaluation
Screen neuroprotective drugs and evaluate the neurotoxicity of compounds using human astrocyte models (such as iPSC-differentiated cells).
Efficiently and quantitatively detect changes in key indicators including cell viability, apoptotic markers and inflammatory factor expression after drug treatment to provide objective quantitative data.
1.2.4 Neural Development and Organoid Models
Study how astrocytes guide neuronal migration and synaptic formation during brain development, and simulate authentic neural microenvironments in 3D brain organoids.
Z-stack scanning and 3D reconstruction serve as core techniques for observing the morphology and network connections of astrocytes in complex 3D structures, as well as their interactions with neurons.
1.2.5 Synaptic Plasticity and Neural Signal Regulation
Through the tripartite synapse structure, astrocytes directly participate in the recycling and clearance of neurotransmitters at synapses, dynamically regulating neural signal transmission.
Combined with specific fluorescent probes or genetically encoded calcium indicators (e.g., GCaMP), the system can capture calcium wave signals of astrocytes during neural activities in real time.
1.3 Astrocyte Imaging Protocol
This study adopts the high-resolution imaging capability of confocal microscopy to reconstruct and quantify 3D images obtained by Z-stack scanning. Key parameters including cytoskeleton fluorescence intensity, apparent cell volume and branch number are precisely measured for statistical analysis. In this experiment, Hoechst33342 and GFAP antibodies are used to visualize the nucleus and cytoskeleton of astrocytes.
With the NCF1000 confocal microscope equipped with a 60× high-power apochromatic objective, cell observation is performed under 405 nm and 561 nm laser channels. Z-stack scanning is carried out with a step size of 0.3 μm, acquiring 47 layers of optical sections to generate high-precision 3D stereoscopic images of astrocytes.
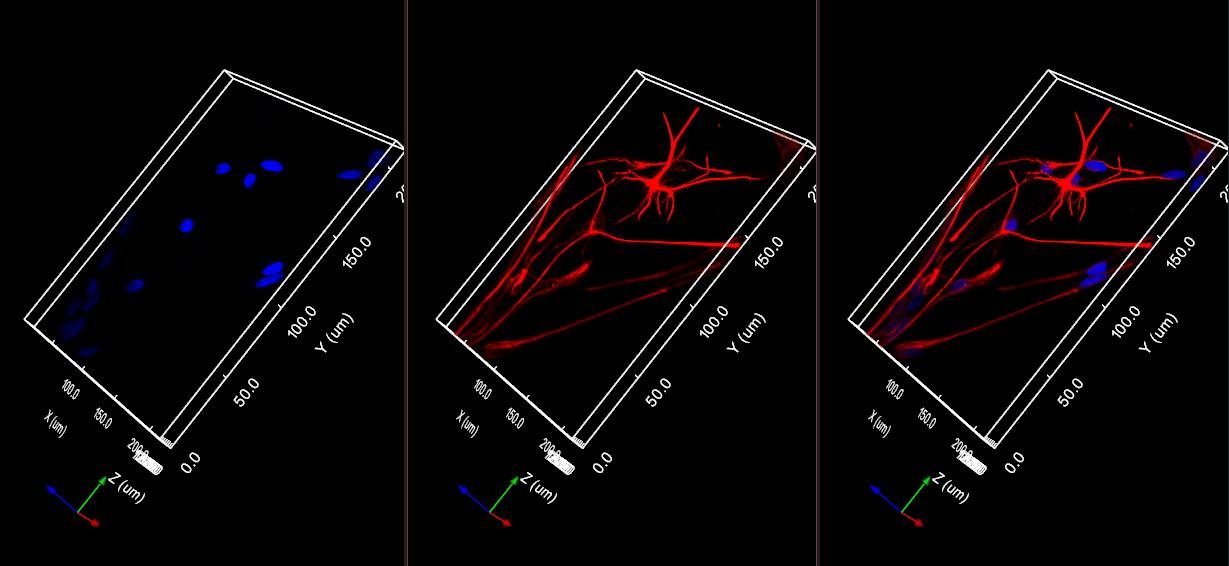
Figure 2 | Astrocytes in mouse brain slices
Imaging Parameters
Microscope: NCF1000 Confocal Microscope
Objective: 20×, NA=0.75
Resolution: 1024×1024 pixels
Scan Mode: Combined Z-stack scanning and time-sharing scanning
Laser Channels: 405 nm, 561 nm, 640 nm
Staining Protocol
Sample: Mouse brain slice
Sample Type: Floating slice
Sample Thickness: 30 μm
Three-channel Staining
- Microglia: Alexa Fluor 568
- Activation signal: Alexa Fluor 647
- Cell nucleus: DAPI
II. Technical Advantages of NCF1000 Confocal Microscope
2.1 Z-stack Scanning Eliminates Background Interference
Astrocyte cultures have a certain thickness. Traditional wide-field microscopy suffers from blurred backgrounds and reduced contrast caused by out-of-focus fluorescence signals. The pinhole design of the confocal microscope effectively blocks out-of-focus light and acquires continuous optical sections via Z-stack scanning.
This ensures high clarity of each optical section, laying a solid foundation for subsequent accurate 3D reconstruction and quantitative analysis.
2.2 Multi-channel Fluorescence Imaging for Synchronous Detection
This experiment requires simultaneous observation of cell nuclei and cytoskeletons. The confocal microscope supports multi-channel fluorescence imaging: DAPI labels cell nuclei (blue channel), while phalloidin (TRITC or FITC-labeled) specifically stains F-actin microfilaments (red channel). The supporting software can precisely overlay signals from different channels, clearly presenting the positional relationship between nuclei and cytoskeletons and avoiding signal misalignment.
III. Common Experimental Problems and Solutions
Q1: Low signal-to-noise ratio and high background in acquired images. What are the possible causes?
A1: Main causes include insufficient sample fixation, incomplete washing leading to strong background fluorescence, and non-specific binding or excessive concentration of antibodies. Solutions: optimize fixation and washing procedures; perform antibody titration and set up control groups to eliminate non-specific signals.
Q2: Weak sample fluorescence signals. How to solve it?
A2: This problem is usually caused by invalid antibodies/dyes or insufficient cell permeabilization. It is recommended to verify dye activity first and ensure the correct use of cell permeabilizers.
Q3: Discontinuous structures along the Z-axis. How to fix it?
A3: Excessively large Z-step size leads to insufficient axial resolution and missing structural details. Reduce the Z-step size or adjust the sampling distance during post-processing to improve axial structural continuity.