
 Products







1. Experimental scenario: Fluorescence characteristics and spatial distribution analysis of perovskite quantum dots (PQDs) composites.
1. Perovskite Quantum Dots, PQDs) are a kind of semiconductor nanomaterials with perovskite crystal structure, and its core structure is composed of ABX₃-type perovskite crystals. Due to its excellent optical properties, including high photoluminescence efficiency, narrow emission spectrum, tunable emission wavelength and good color purity, perovskite quantum dots have shown wide application potential in display devices, photoelectric detection, biological imaging and optical anti-counterfeiting.
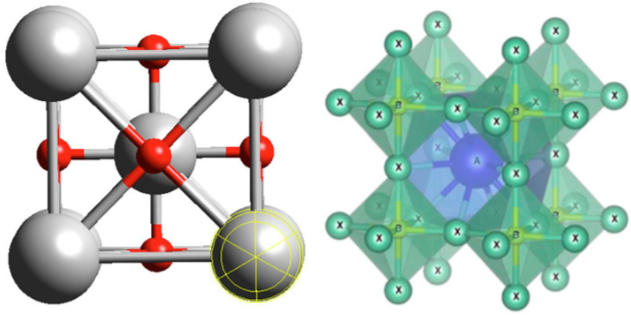
Figure 1: Structure diagram of perovskite crystal
2. In this experiment, the user constructs a composite structure of perovskite quantum dots modified by SiO₂/SAM interface, and observes and analyzes the fluorescence distribution, luminescence characteristics and stability of perovskite quantum dots by laser confocal microscope, which provides a visual characterization means for studying the optical properties and surface regulation methods of perovskite quantum dots. Using NCF1000 laser confocal microscope, mainly using 20X apochromatic objective lens and high-power laser bands of 405nm, 488nm, 561nm and 640nm, the multi-channel fluorescence imaging and Z-sequence scanning of perovskite quantum dots (PQDs) fixed on SiO₂/SAM substrate were carried out, and the distribution, fluorescence intensity change and spatial positioning information of PQDs on the substrate surface were analyzed through three-dimensional reconstruction, which provided information for studying the optical properties and stability of perovskite quantum dots.
Second, the user effect
The perovskite quantum dots (PQDs) fixed on the SiO₂/SAM substrate were imaged by multi-channel fluorescence imaging and Z-sequence scanning with 20X apochromatic objective lens.
Users use NCF1000 laser confocal microscope equipped with 20X objective lens (0.75 NA) to perform multi-channel fluorescence imaging on PQDs. PQDs selects the excitation band of 488nm to emit green light; SiO₂/SAM substrate uses excitation bands of 405nm, 561nm and 640nm to emit blue light, red light and purple light respectively. Among them, the base pattern includes the zodiac, circle, square and so on.
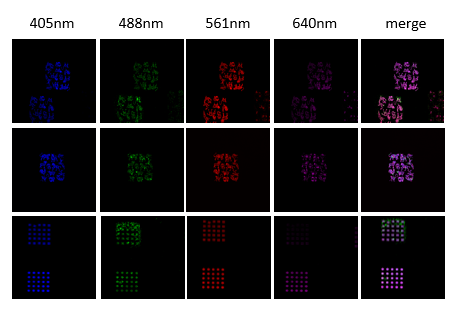
Figure 2: 4-Channel Confocal Diagram
Realization of three-dimensional spatial information acquisition by z-sequence imaging
In order to obtain the three-dimensional spatial distribution information of PQDs, users use NCF1000 laser confocal microscope equipped with 20X objective lens (0.75 N.A) to obtain Z-sequence images of different visual fields of PQDs and render and observe the three-dimensional model.
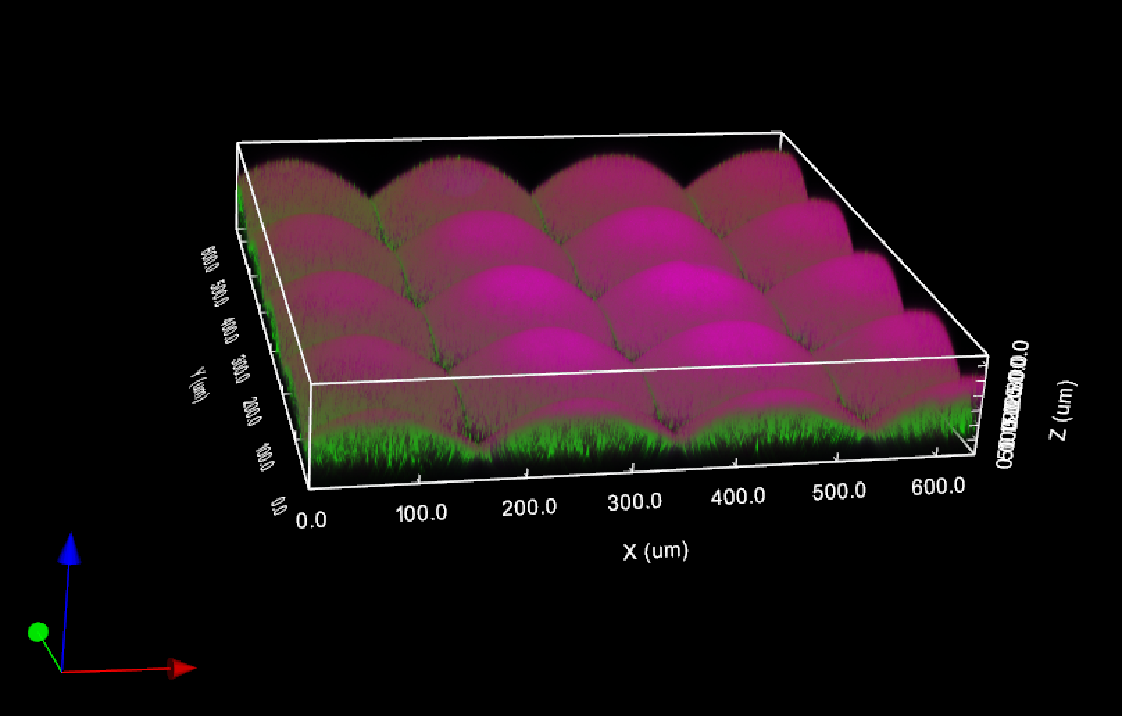
Figure 3: 3D repainting of 3:PQDs
Third, how can NCF1000 confocal microscope help the experiment
1. Multicolor scanning
The NomisPro X-C software used with NCF1000 supports multiple laser channels for scanning.
Provides four scanning modes: four-channel simultaneous scanning, every-channel scanning, time-sharing scanning and custom scanning.
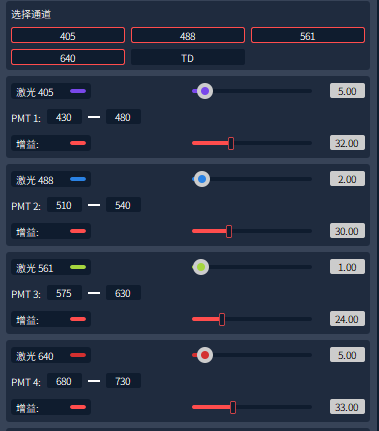
Figure 4: Laser Channel Selection
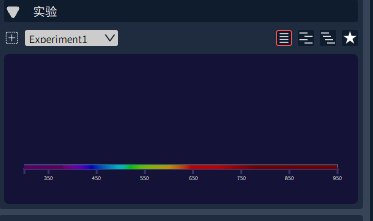
Figure 5: Different scanning modes
2. LUT color scale adjustment function
It can be adjusted according to the fluorescence intensity of each channel substrate and PQDs, providing two ways: manual color scale adjustment and automatic color scale adjustment.

Figure 6: LUT color scale adjustment
3. Z-sequence image acquisition
Z-Stack images are used for 3D imaging. Z-Stack includes two modes: Start/ End mode and Center mode. In the "Start/ End" mode, the user determines the Z-axis range of 3D imaging by setting the upper and lower boundaries, as shown in Figure 7. In the "Center" mode, the user determines the imaging range by specifying the middle position of the Z axis and the required 3D thickness, as shown in Figure 8. This function allows researchers to accurately obtain the structural information of samples in three-dimensional space, thus improving the resolution and details of imaging.
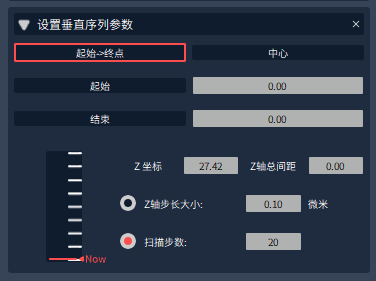
Figure 7: "start-end" mode
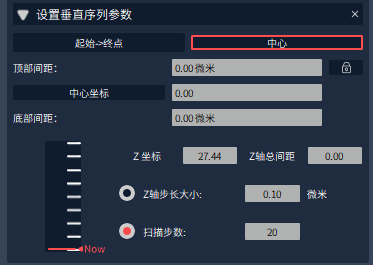
Figure 8: "center" mode
4. 3D display function
The 3D display function refers to the imaging mode of processing Z-sequence 2D images into 3D models through algorithms.
Image acquisition software NomisPro X-C or offline version software NomisPro X-V of NCF1000 laser confocal microscope can import Z-sequence images, and then click 3D images to render the model and automatically generate images, as shown in Figure 9.
In the 3D display interface, color gradation adjustment of each stereoscopic channel can be realized and multi-directional display can be performed, as shown in Figure 10.
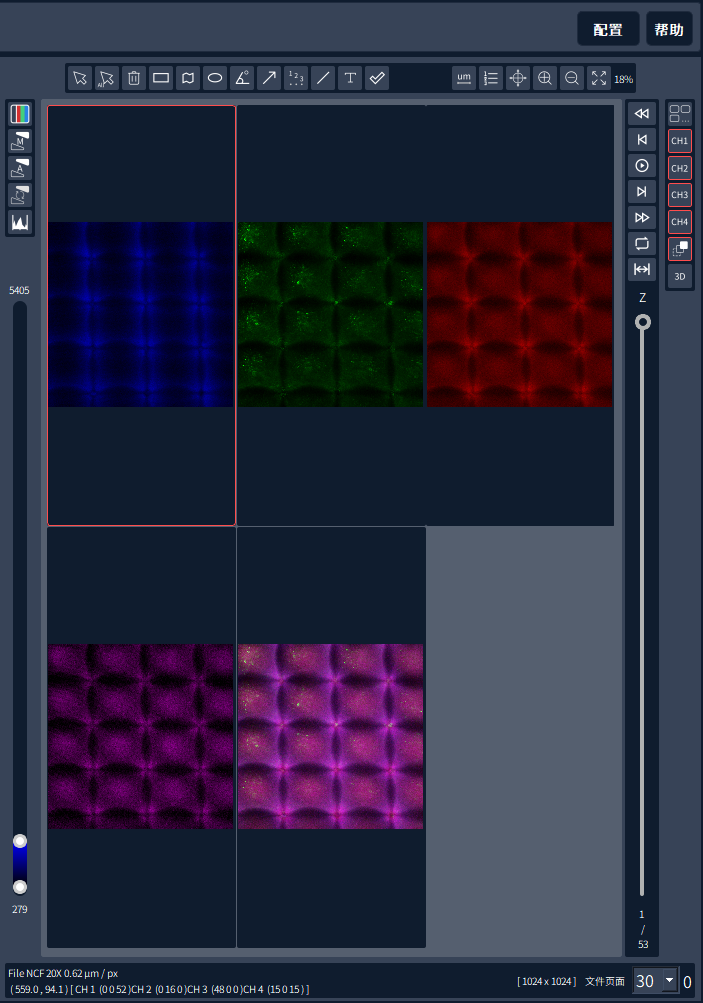
Figure 9: 3D image display portal interface
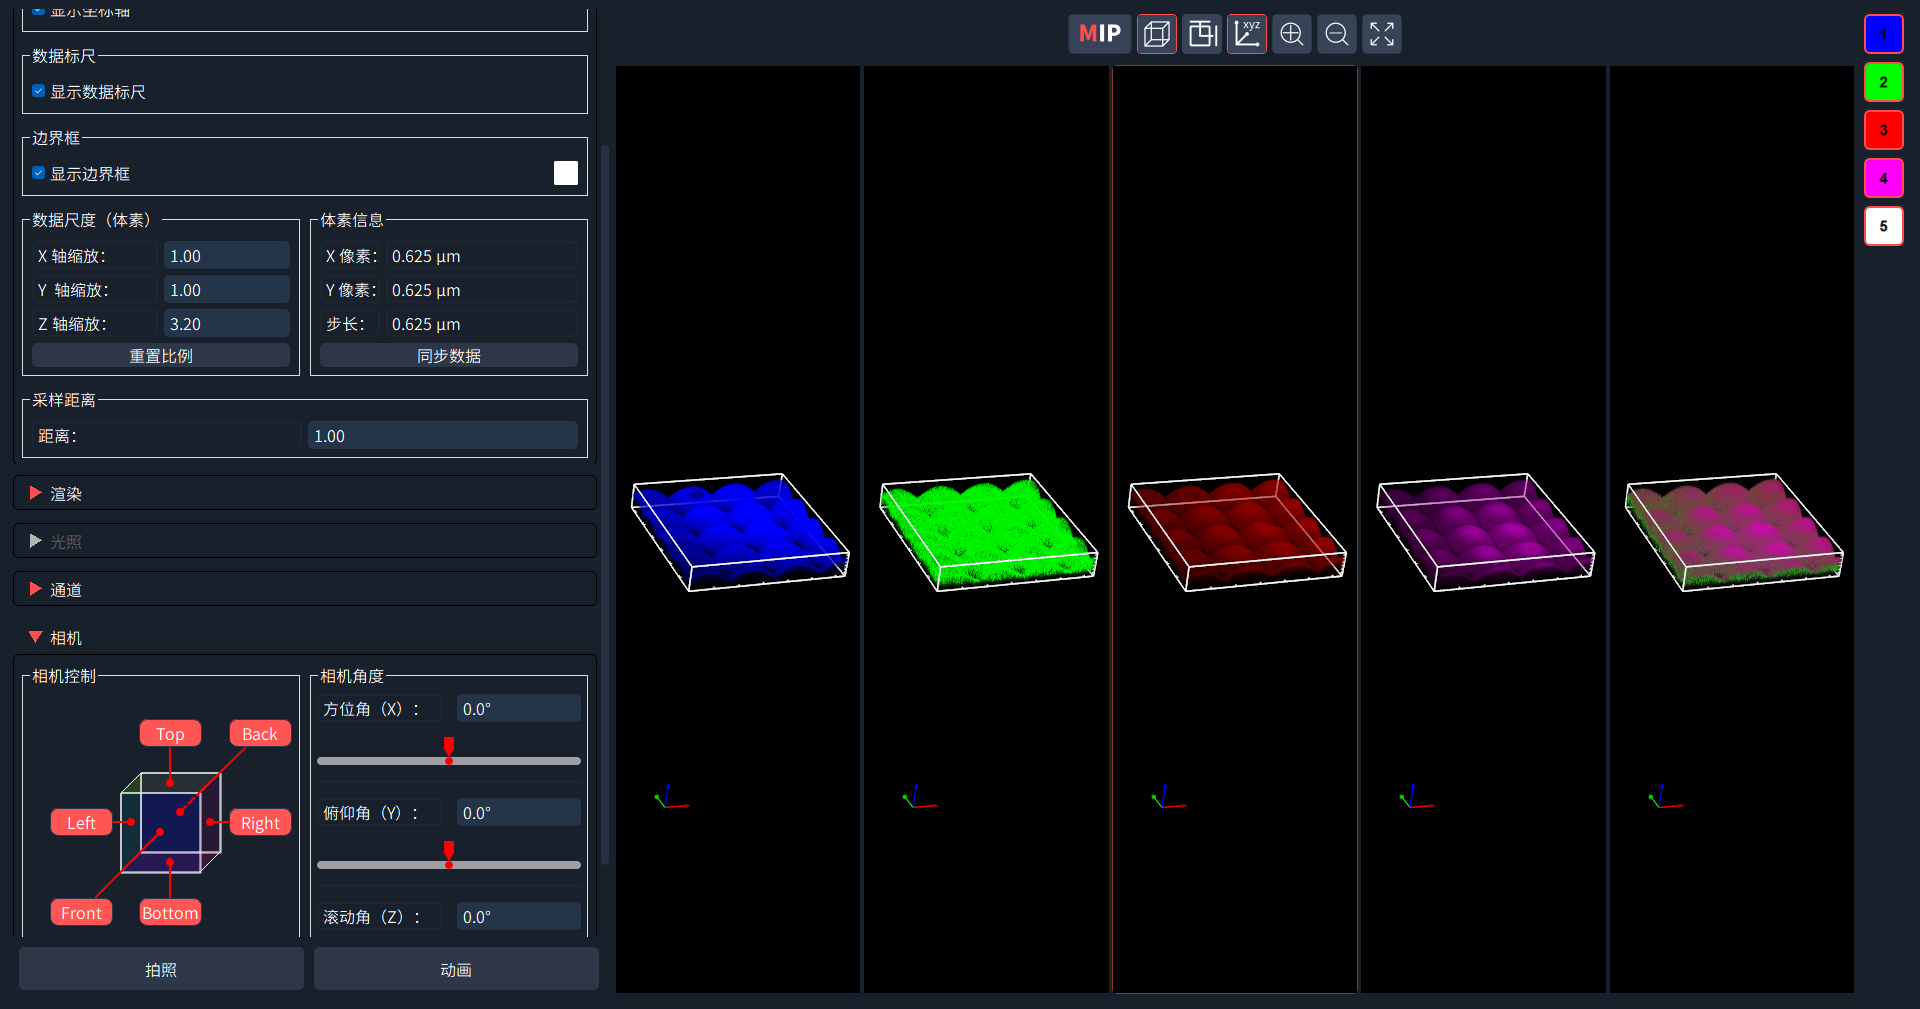
Figure 10: 3D image display and adjustment interface
Fourth, the problems that may be encountered during the experiment
Q1: During sample preparation, the direction of the pattern is inconsistent with the direction of the glass bottom, which leads to the improper angle of the imaging picture. How to adjust it?
A1: NomisPro X-C software provides rotation function, and can input any angle by numerical value, thus obtaining satisfactory imaging effect.