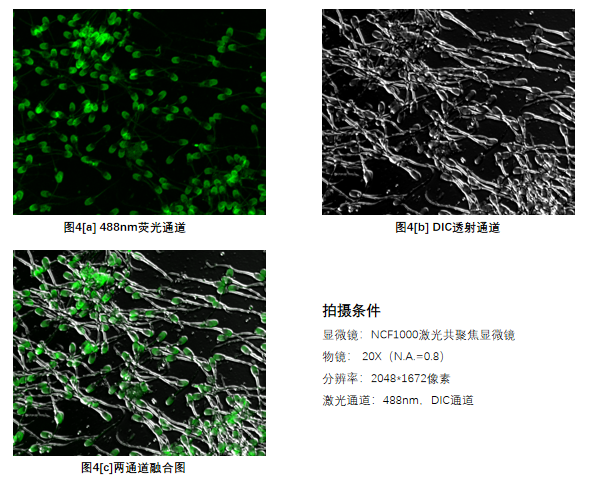
I. Experimental Scenario: Fluorescence Co‑localization Analysis
1. Fluorescence co‑localization analysis is a widely‑used analytical method in fluorescence microscopy. It mainly investigates the spatial relationships between two or more distinct biomolecules (such as proteins, nucleic acids, organelles) within cells or tissues. Specifically, it determines whether these biomolecules reside within identical subcellular compartments (“co‑localization”), so as to further decipher biological processes.
Core Principles
1. Fluorescence labeling: Use fluorescent probes with distinct emission wavelengths (e.g., fluorescent dyes, fluorescent proteins, immunofluorescent antibodies) to specifically label two or more target molecules (A and B).
2. Multi‑channel imaging: Fluorescence microscopes (confocal microscopes are preferred for their optical sectioning capability to reduce background noise) capture images under channels matching the emission wavelengths of respective fluorescent probes.
- Channel 1 (Ch1, e.g., green): Label molecule A
- Channel 2 (Ch2, e.g., red): Label molecule B
3.*Image overlay and analysis: Images from multiple channels are superimposed, typically with pseudo‑colors such as green and red.
- Yellow‑colored regions: Green‑channel and red‑channel signals co‑exist at comparable intensities at the same pixel, suggesting potential co‑localization of molecule A and molecule B.
- Pure‑green or pure‑red regions: Only one molecule is detected, indicating no co‑localization.
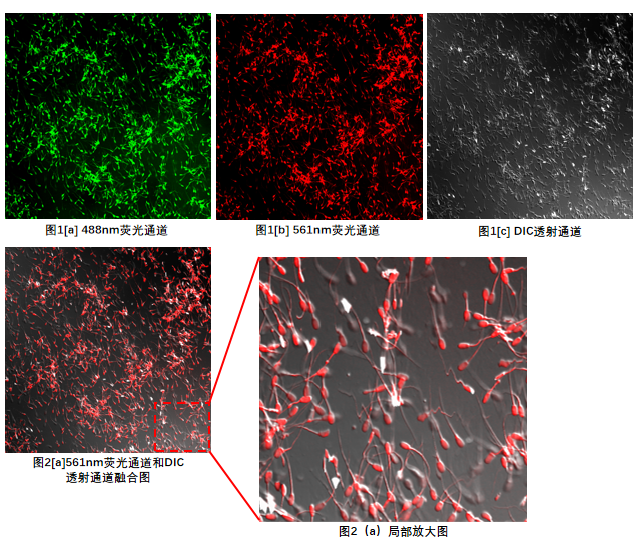
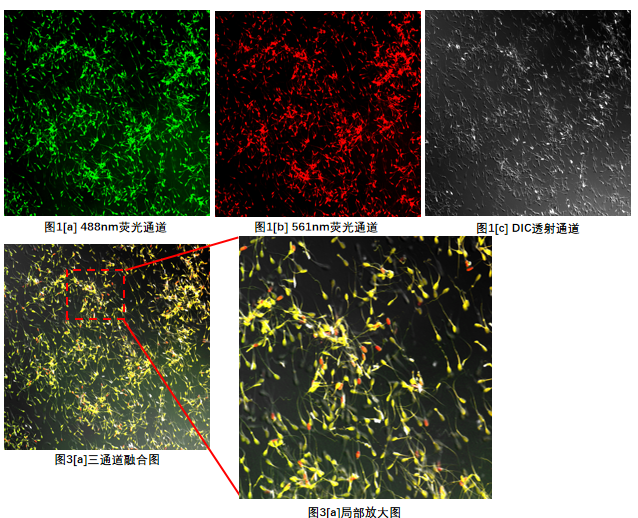
2. In this experiment, the NCF1000 confocal microscope was deployed. 10× and 20× apochromatic objectives were mainly used. Combined DIC transmission imaging together with 488 nm and 561 nm fluorescence channels enabled multi‑modal imaging. Multi‑channel acquisition supports qualitative and quantitative analysis of fluorescent proteins with varied distribution patterns and signal intensities. It facilitates observation of cellular morphological structures, investigation of mechanisms of labeled proteins, and evaluation of spatial distribution and co‑localization degree of target proteins on organelles. Meanwhile, combined DIC transmission and fluorescence imaging reveals the relative position of fluorescence signals within whole tissues or individual cells.
- Multi‑channel Image Fusion for Visual Inspection
Fluorescence co‑localization experiments generally rely on multi‑channel acquisition. Different combinations of channels generate varied fused images. Visual inspection of overlaid fused images yields subjective qualitative conclusions. In addition, the built‑in co‑localization tool can process fused images to obtain objective quantitative co‑localization metrics.
Imaging Conditions
Microscope: NCF1000 Laser Confocal Microscope
Objective: 10× (N.A.=0.45)
Resolution: 2048 × 2048 pixels
Laser Channels: 488 nm, 561 nm, DIC channel
The DIC channel visualizes overall sperm‑cell morphology and delivers images with quasi‑3D relief effects. Overlaying DIC with the 561 nm fluorescence channel localizes corresponding fluorescent proteins inside sperm cells. Similarly, DIC can be fused with the 488 nm fluorescence channel for protein localization.
- Multi‑channel Image Fusion for Visual Inspection
Fluorescence co‑localization experiments are typically performed with multi‑channel acquisition. Different channel combinations generate distinct fused images. Visual inspection of overlaid fused images delivers subjective qualitative conclusions. Meanwhile, the built‑in co‑localization tool can process fused images to obtain objective quantitative co‑localization data.
Imaging Conditions
Microscope: NCF1000 Laser Confocal Microscope
Objective: 10× (N.A.=0.45)
Resolution: 2048 × 2048 pixels
Laser Channels: 488 nm, 561 nm, DIC channel
The three‑channel fused image enables distribution assessment of different fluorescent proteins in sperm cells by color cues. For example, yellow signals indicate the presence of fluorescent proteins corresponding to both the 488 nm and 561 nm channels. Red‑only regions indicate loss of the 488 nm‑channel fluorescent‑protein signal, which may be caused by cell death and ceased substance exchange. Actual causes shall be analyzed on a case‑by‑case basis.
- Multi‑channel Image Fusion for Visual Inspection
Fluorescence co‑localization experiments are typically performed with multi‑channel acquisition. Different channel combinations generate distinct fused images. Visual inspection of overlaid fused images delivers subjective qualitative conclusions. Meanwhile, the built‑in co‑localization tool can process fused images to obtain objective quantitative co‑localization data.
The DIC channel captures the overall morphology of sperm cells and produces images with quasi‑3D relief effects. Overlaying DIC with the 488 nm fluorescence channel allows localization of target fluorescent proteins within sperm cells.
II. How the NCF1000 Confocal Microscope Facilitates the Experiment
1. Multi‑color Scanning
- The NomisPro X‑C software for NCF1000 supports scanning with multiple excitation channels.
- When spectral crosstalk occurs during multi‑color scanning, three scanning modes are available: four‑channel time‑sequential scanning, dual‑channel simultaneous / time‑sequential scanning, and custom scanning. These modes avoid simultaneous excitation of adjacent channels.
2. LUT Level Adjustment Function
- Adjust LUT levels according to the staining status and fluorescence‑intensity requirements of each channel. Both manual and automatic level adjustment modes are provided.
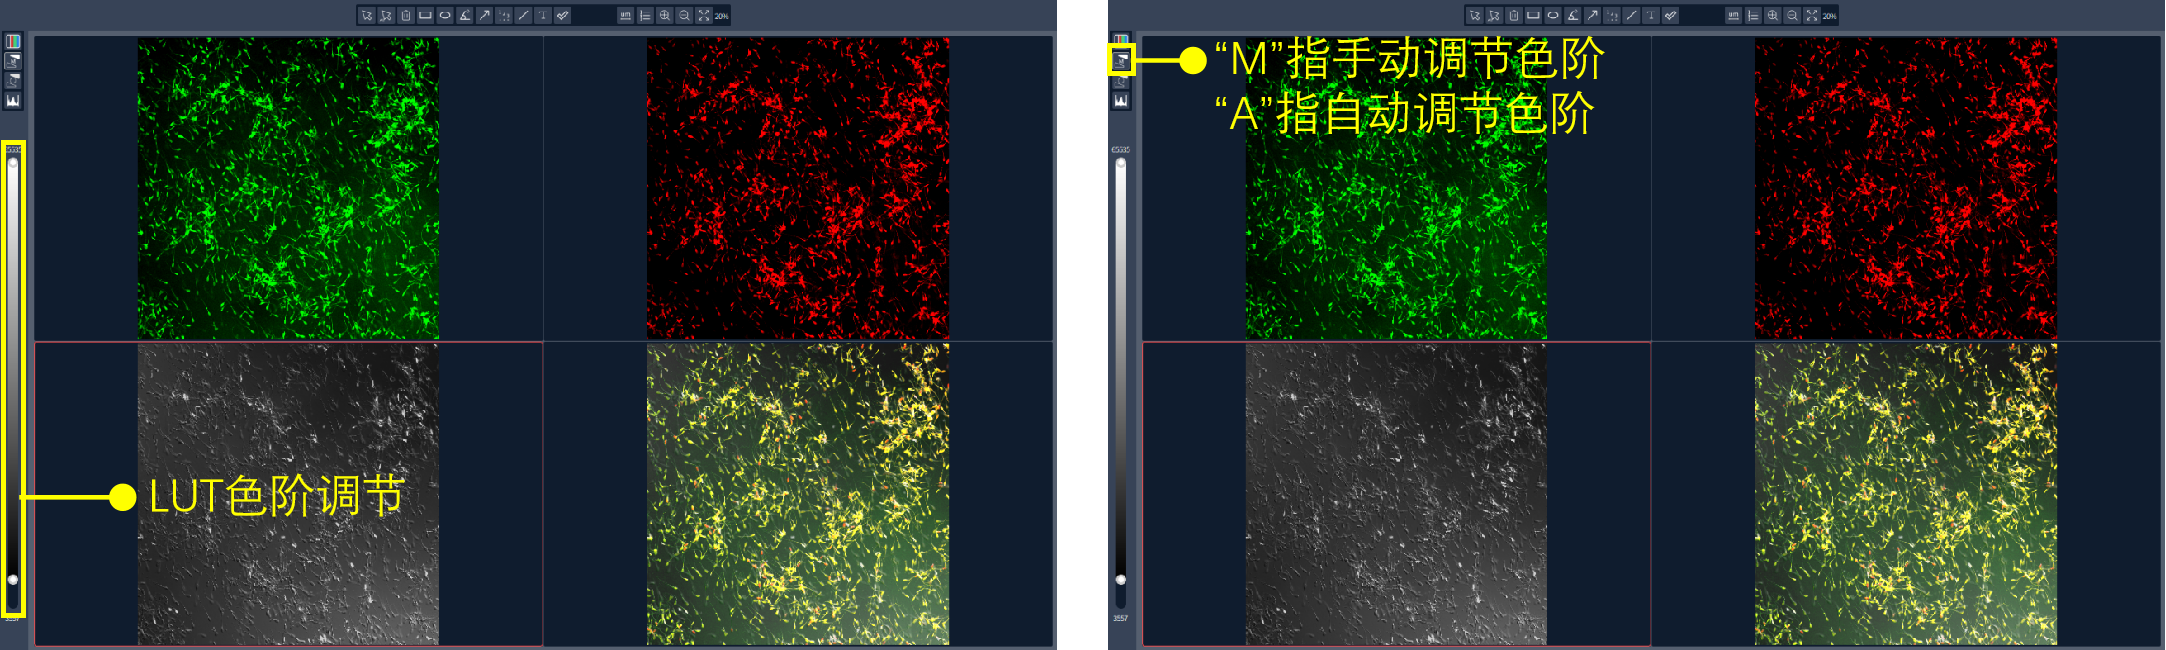
Figure 5: Schematic diagram of LUT adjustment
3. Co‑localization Analysis Function
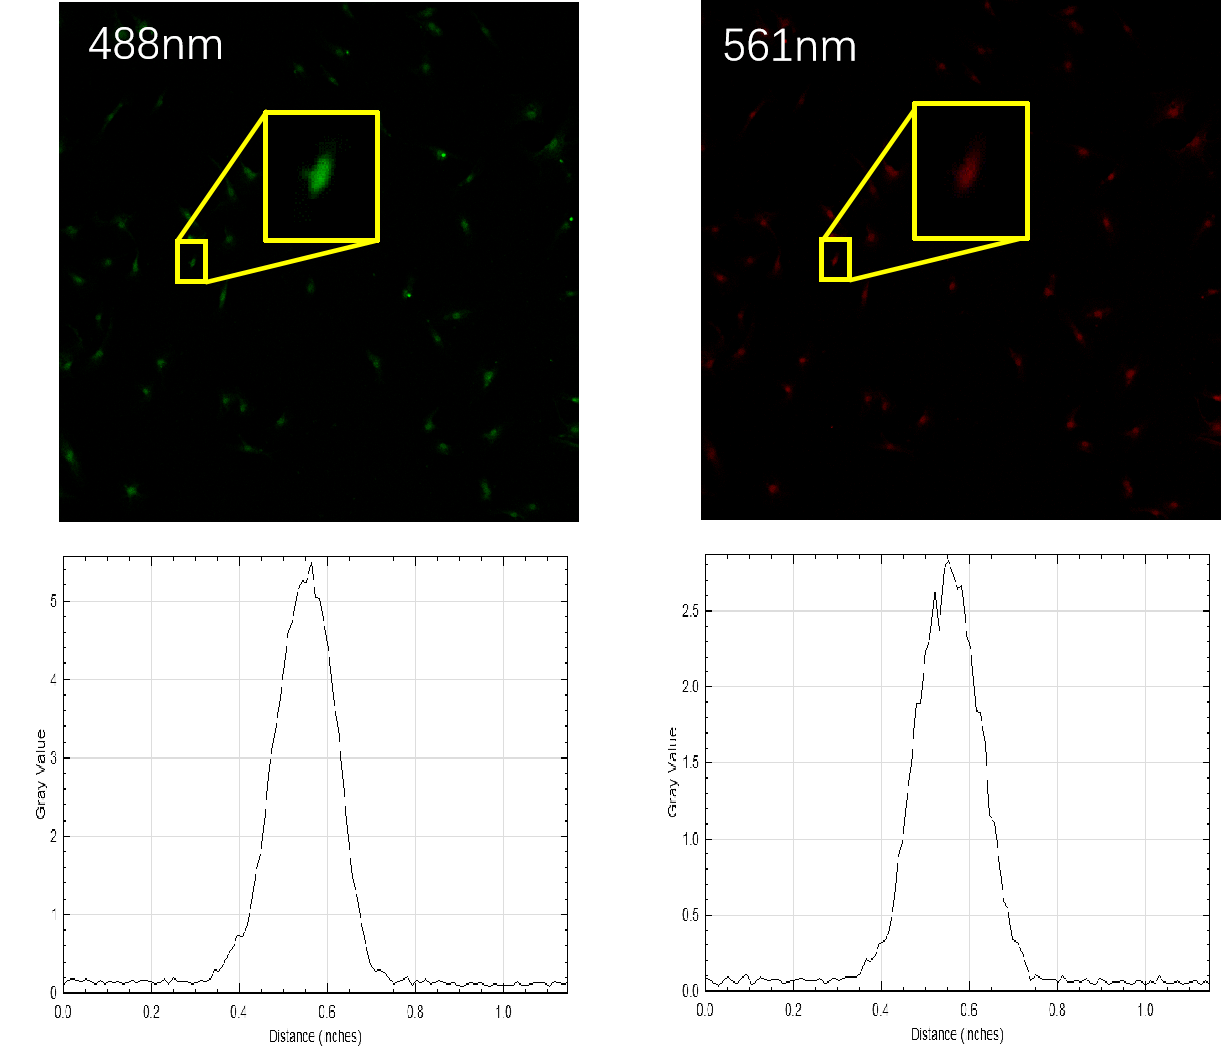
- Qualitative analysis: Select a region and run Plot Profile to obtain grayscale‑intensity variation curves. Figure 9 provides preliminary evidence of co‑localization between proteins labeled by the 488 nm and 561 nm channels.
Figure 6: Grayscale‑intensity profile curve
II. How the NCF1000 Confocal Microscope Facilitates the Experiment
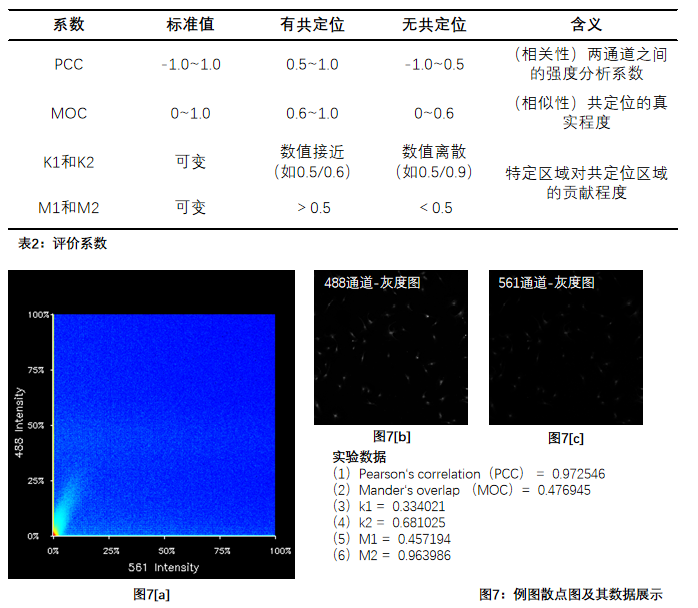
① Use plugins such as Colocalization Finder for quantitative analysis to generate co‑localization scatter plots (Figure 7[a]). The co‑localization correlation is judged by scatter‑point distribution. Points closer to the diagonal represent stronger co‑localization; greater deviation represents weaker co‑localization.
② Extract quantitative metrics to further quantify co‑localization results, including Pearson’s Correlation Coefficient (PCC), Manders Overlap Coefficient (MOC), overlap coefficients K1 and K2, and Manders Co‑localization Coefficients M1 and M2 (MCC).
III. Common Experimental Issues
Q1: What configuration points should be noted for DIC imaging?
① This instrument adopts motorized DIC with automatic control for the upper swing‑arm assembly. For non‑motorized DIC systems, push the DIC slider into the optical path; otherwise confocal DIC imaging will not work properly.
② Lasers emit linearly‑polarized light. For laser‑based DIC imaging, pull the polarizer out of the optical path or set it to the empty position.
③ The analyzer shall stay in the optical path for DIC imaging. Rotate the condenser turret to the DIC‑optics position matching the objective; mis‑configuration will impair DIC image quality.
④ DIC features a short optical path and requires relatively low laser power. When performing simultaneous multi‑mode acquisition, pay close attention to the gain setting for the DIC channel.
⑤ This 5‑detector model is equipped with an independent detector for DIC, supporting simultaneous 5‑channel acquisition. On other variants, the 640 nm channel and DIC channel share one detector and cannot be imaged simultaneously.
Q2: Can unsealed samples be observed in upright orientation on the NCF1000 confocal microscope?
Not recommended. The NCF1000 is built on an inverted‑microscope platform. Samples must be mounted with 0.17 mm coverslips and loaded in inverted orientation to acquire valid, high‑quality images.

 Products