I. Experimental Scenario: 3D Observation of Mouse Dermal and Epidermal Cells Immobilized in Hydroge
1. Hydrogel is a soft material with a unique hydrophilic network structure. Its properties including swelling behavior, mechanical performance and permeability are determined by its structure (cross‑linking mode, network density and hydrophilic groups). Hydrogels are classified by source into natural‑polymer hydrogels, synthetic‑polymer hydrogels and hybrid/composite hydrogels. Hydrogels provide a highly physiologically‑relevant, optically‑transparent and tunable 3D platform for immobilizing mouse dermal and epidermal cells, greatly facilitating microscopic observation. It enables real‑time, dynamic and high‑resolution investigation of fundamental biological behaviors of skin cells, tissue morphogenesis, disease mechanisms and drug effects under near‑in‑vivo conditions.
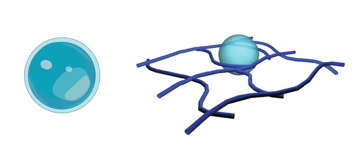
Figure 1: Schematic diagram of hydrogel structure
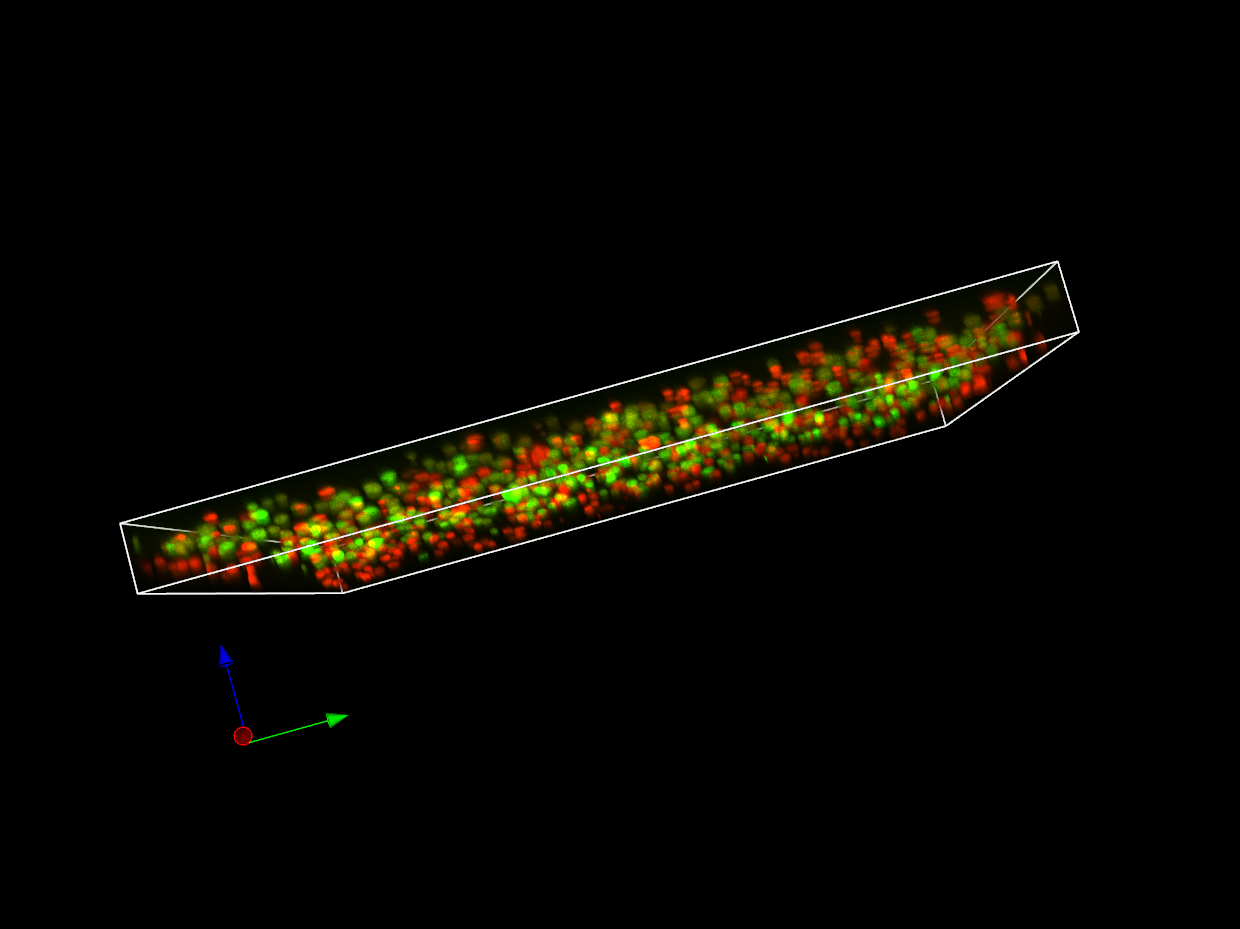
Figure 2: Rendered 3D model
1. Mouse dermal cells refer to primary Mouse Dermal Fibroblasts (MDF), an important cell type isolated from mouse dermal tissue, mostly showing spindle‑shaped or polygonal morphology. Mouse dermal fibroblasts are widely used in tissue engineering, wound repair, skin pathology and drug development. In particular, they can be used to evaluate the regulatory effects of novel materials or drugs in wound‑healing research.
2. Mouse epidermal cells mainly refer to Mouse Epidermal Keratinocytes, the predominant cell type in epidermis, which are critical for maintaining skin integrity and functions. They constitute the skin barrier to prevent water loss and invasion of exogenous harmful substances, and participate in cutaneous immune responses for pathogen defense and skin health maintenance.
In this experiment, users utilized the 3D‑image acquisition and model‑rendering functions of the NCF1000 laser confocal microscope to observe the spatial distribution of dermal and epidermal cells in mouse skin tissue for further research on skin‑development mechanisms.
- 3D Spatial‑distribution Observation of Mouse Dermal and Epidermal Cells Immobilized in Hydrogel
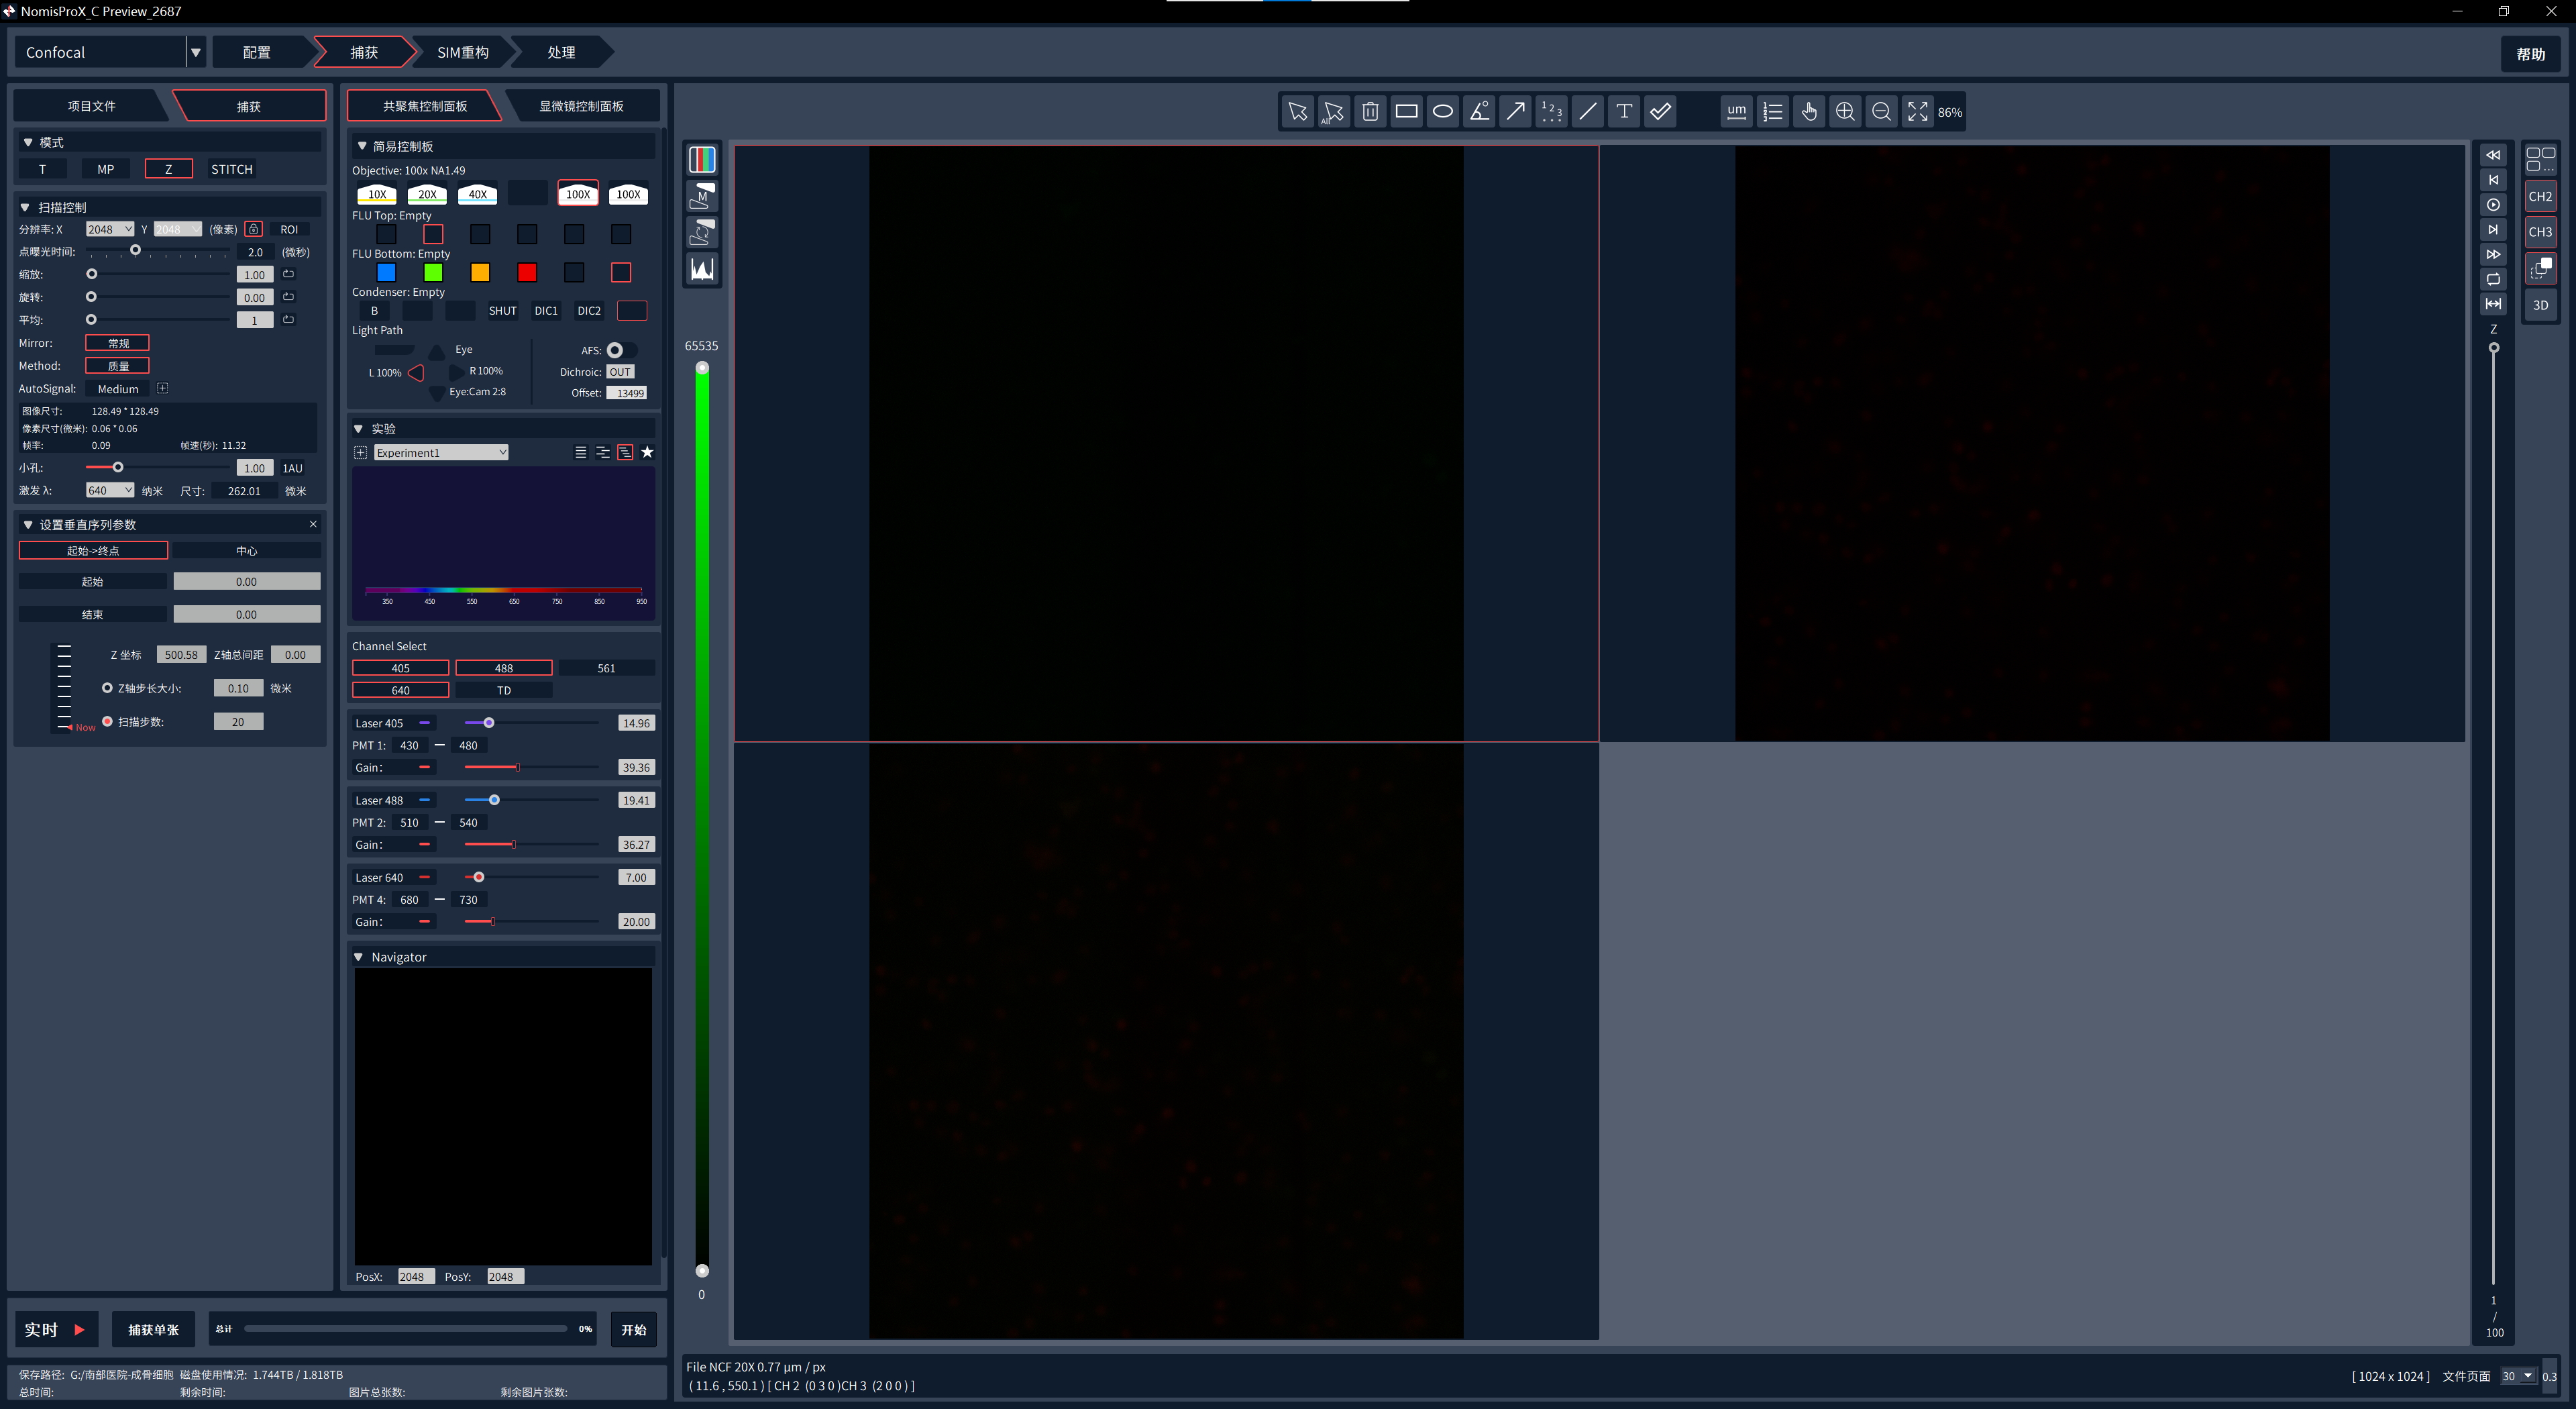
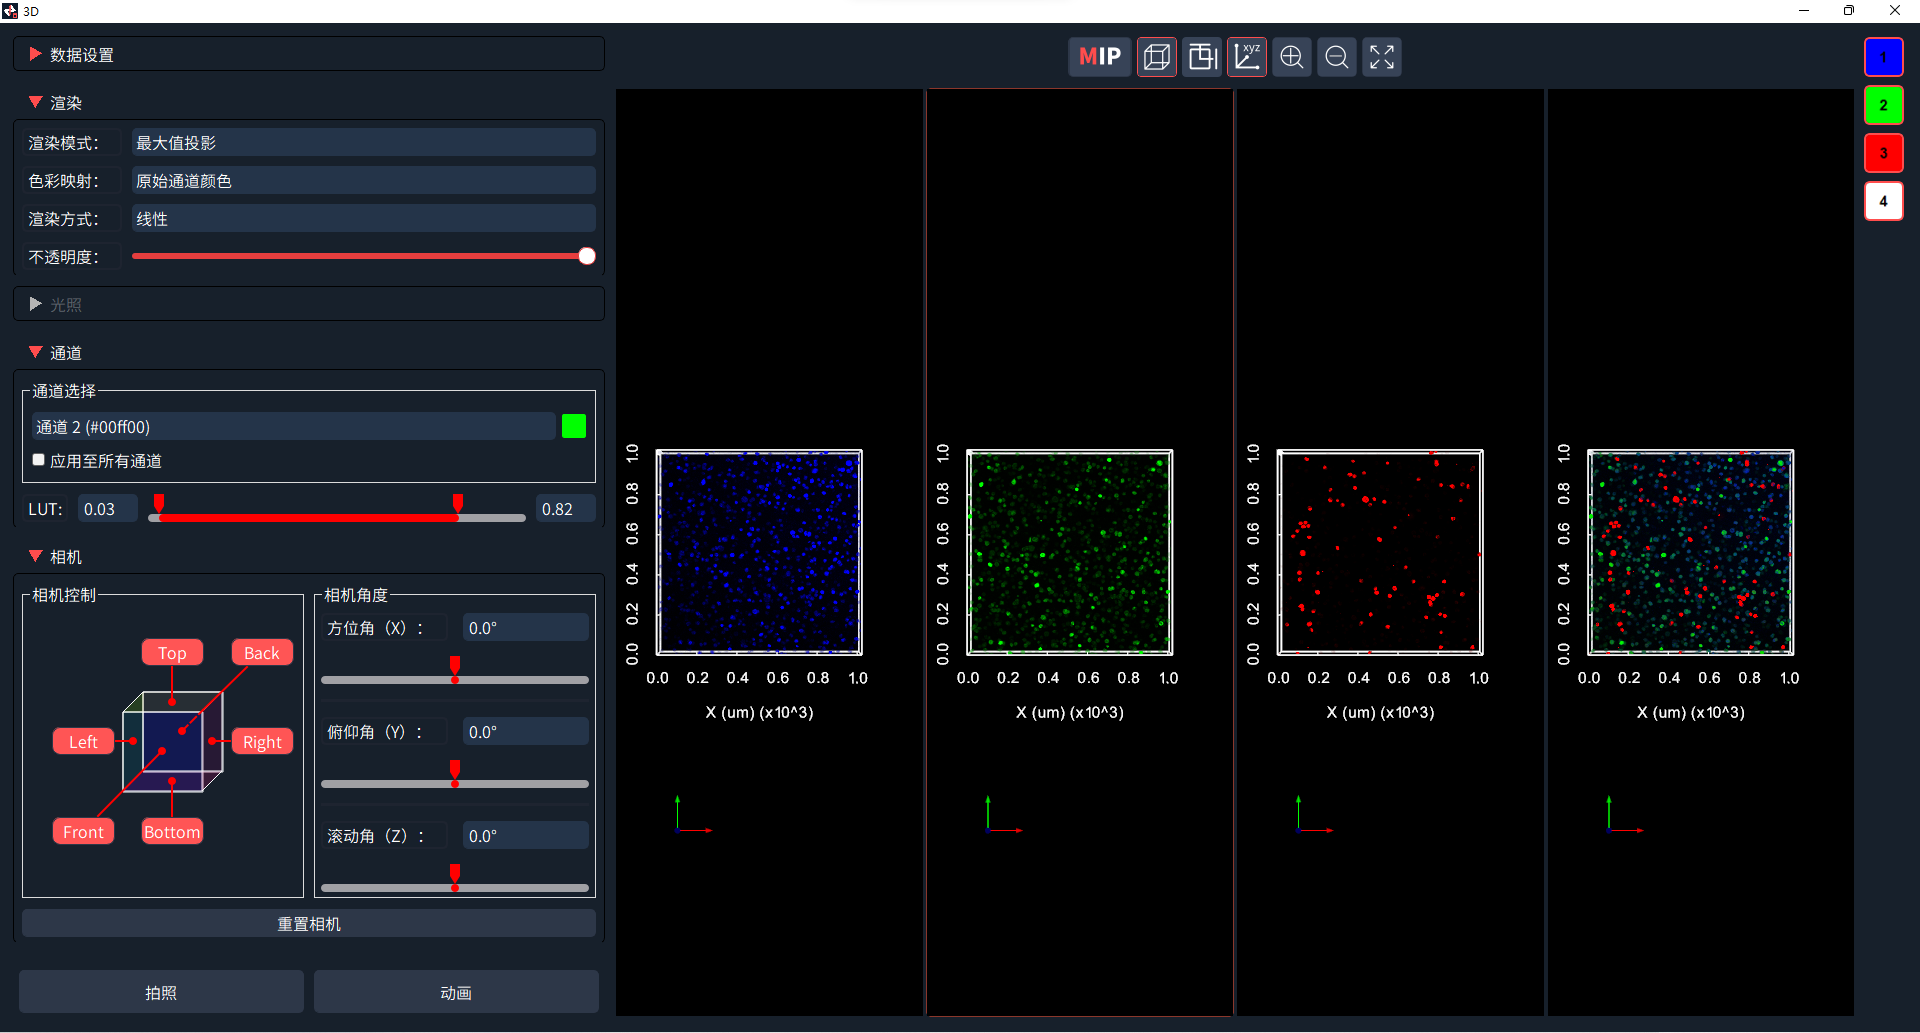
Studies on skin development and morphology frequently focus on mouse dermal and epidermal cells. To better reconstruct their relative positions and interactions in skin tissue, a stable observation model is constructed using transparent polymeric‑network hydrogel for volumetric observation. To acquire comprehensive spatial‑distribution data and high‑definition 3D images of both cell types, users performed Z‑stack acquisition and 3D‑model rendering on NCF1000 laser confocal microscope equipped with a 20× (0.75 N.A.) objective (Figure 3, Figure 4).
Figure 3: Z‑stack acquisition interface
Figure 4: 3D‑model parameter adjustment interface
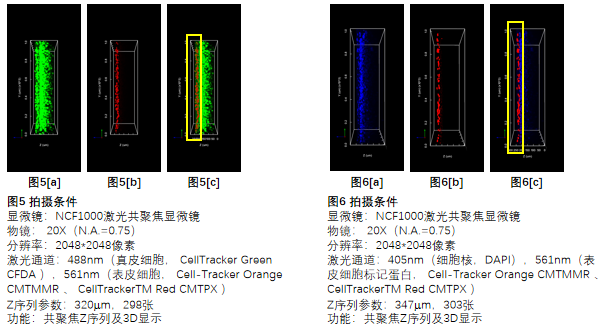
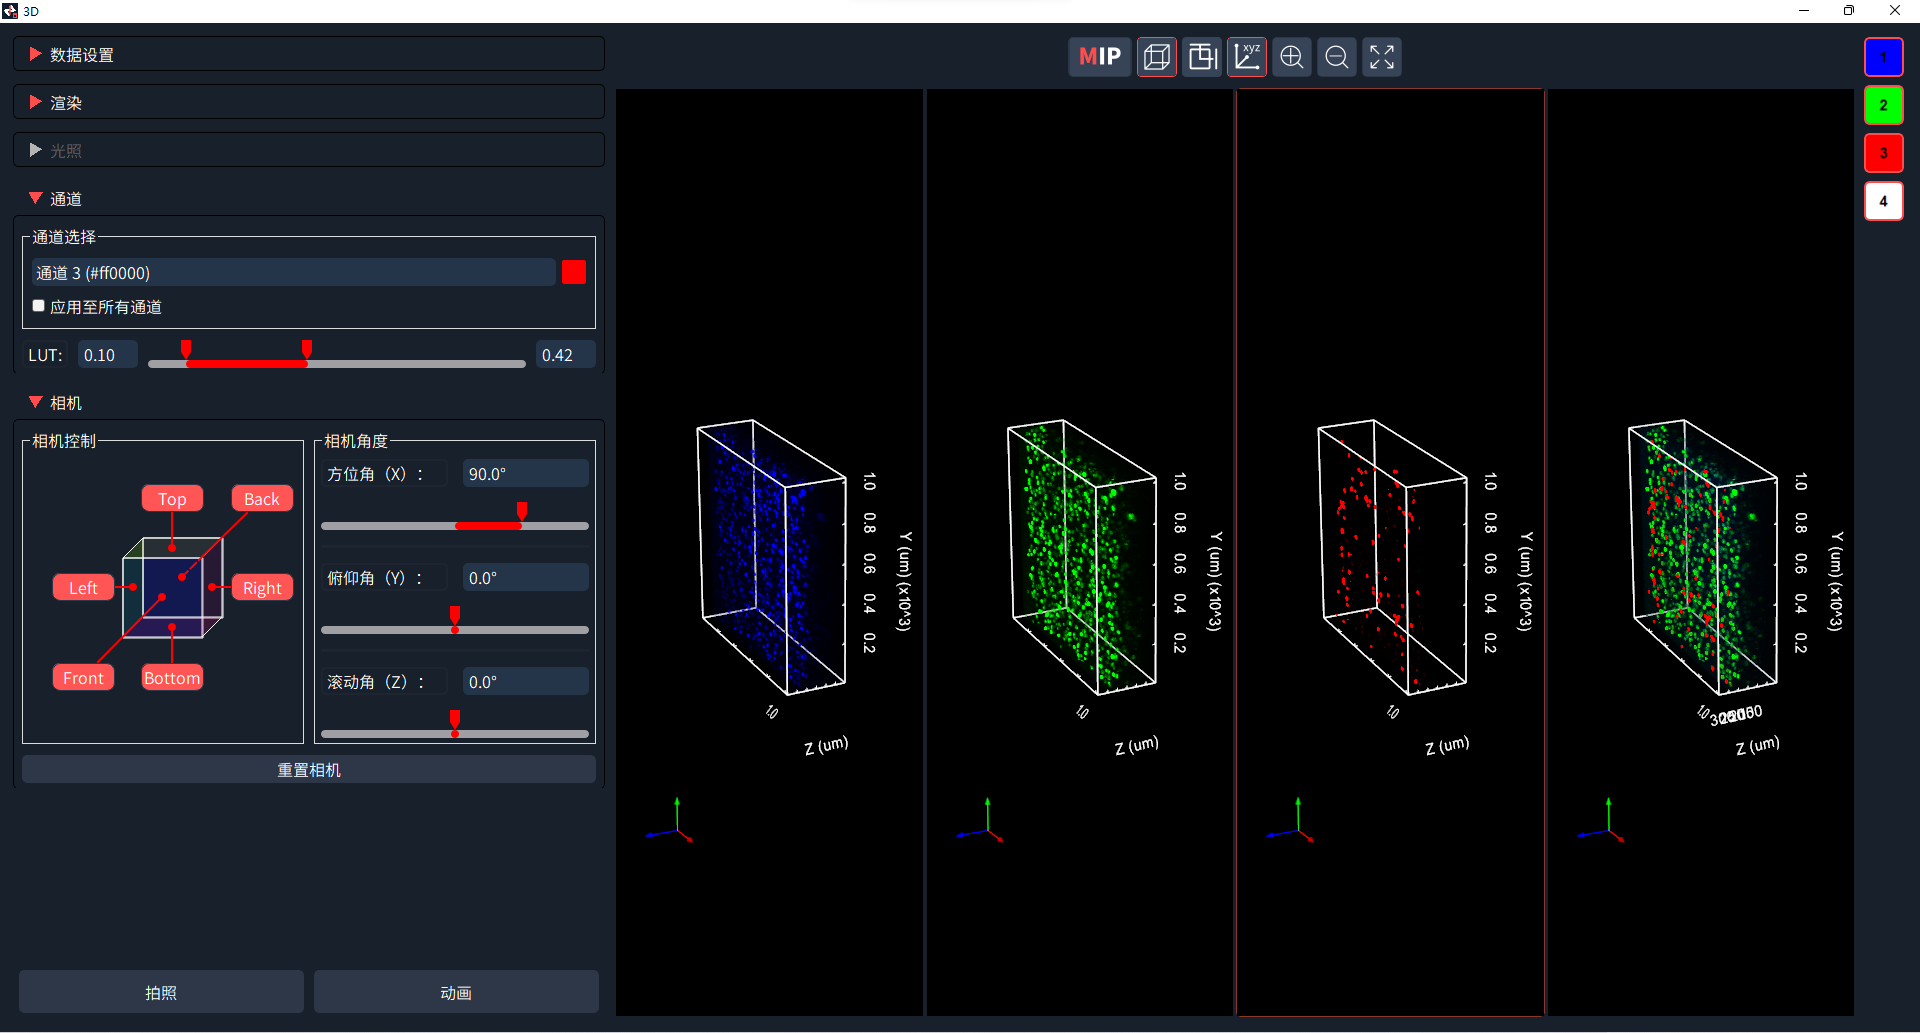
Under normal conditions, the 3D model should show stratified dermal and epidermal layers with a thick dermal‑cell layer. During actual imaging, although the dermal‑cell layer was thick, epidermal‑cell protein (red) fully overlapped with dermal‑cell protein (green) (Figure 5). Subsequent nuclear staining of dermal cells showed that dermal‑cell nuclei (blue) did not overlap with epidermal‑cell protein (red) (Figure 6). These results indicate certain interactions between dermal and epidermal cells, which carry great clinical significance for skin repair.
II. How NCF1000 Confocal Microscope Supports the Experiment
1. Z‑Stack Image Acquisition
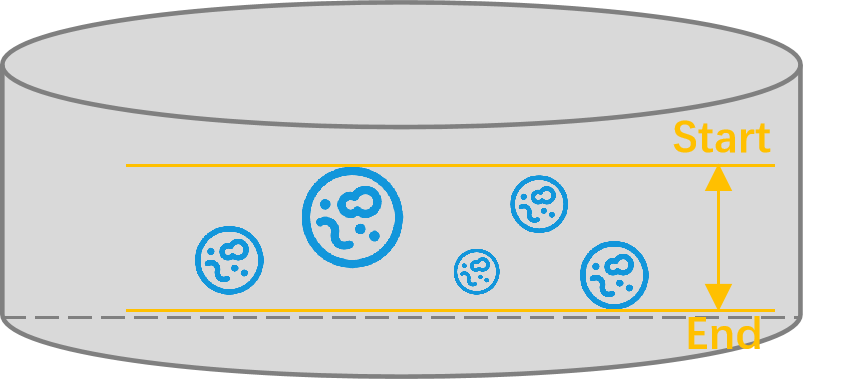
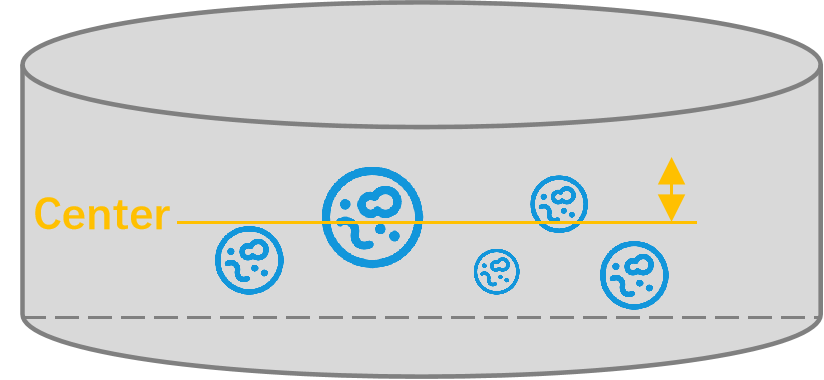
Z‑stack images are used for 3D imaging. Two Z‑stack modes are available: “Start/End” mode and “Center” mode. In “Start/End” mode, users define the Z‑axis range for 3D acquisition by setting upper and lower boundaries (Figure 7). In “Center” mode, the imaging volume is defined by specifying the Z‑axis center position and desired 3D thickness (Figure 8). This function enables researchers to precisely acquire sample structural information in 3D space and improve imaging resolution and detail.
Z‑stack acquisition can be completed via the acquisition software NomisPro X‑C or offline software NomisPro X‑V bundled with NCF1000 laser confocal microscope.
Figure 7: Schematic of Z‑stack interface under “Start/End” mode
Figure 8: Schematic of Z‑stack interface under “Center” mode
2. 3D Visualization Function
- The 3D‑visualization function converts 2D Z‑stack slices into a 3D model via algorithmic processing.
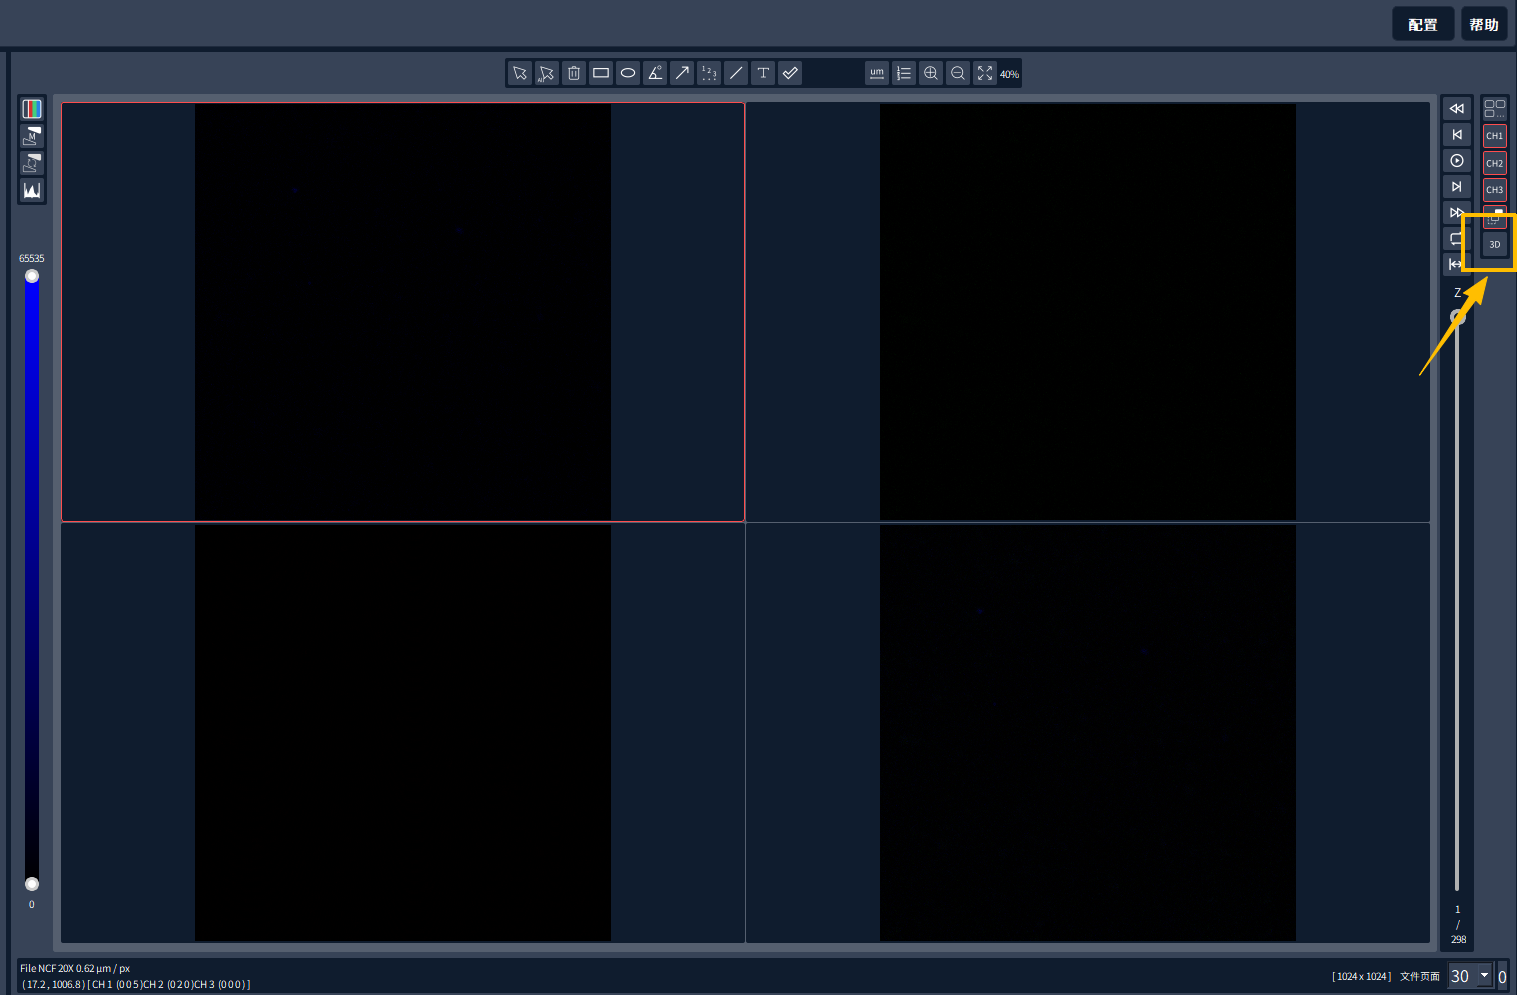
- NCF1000激光共聚焦显微镜配套图像获取软件NomisPro X-C 或离线版软件NomisPro X-V可导入Z序列图像,通过点击3D图像进行模型渲染并自动生成图像,见图9。Z‑stack images can be imported into NomisPro X‑C or offline NomisPro X‑V software bundled with NCF1000. Click the 3D‑image button to trigger model rendering and automatic image generation (Figure 9).
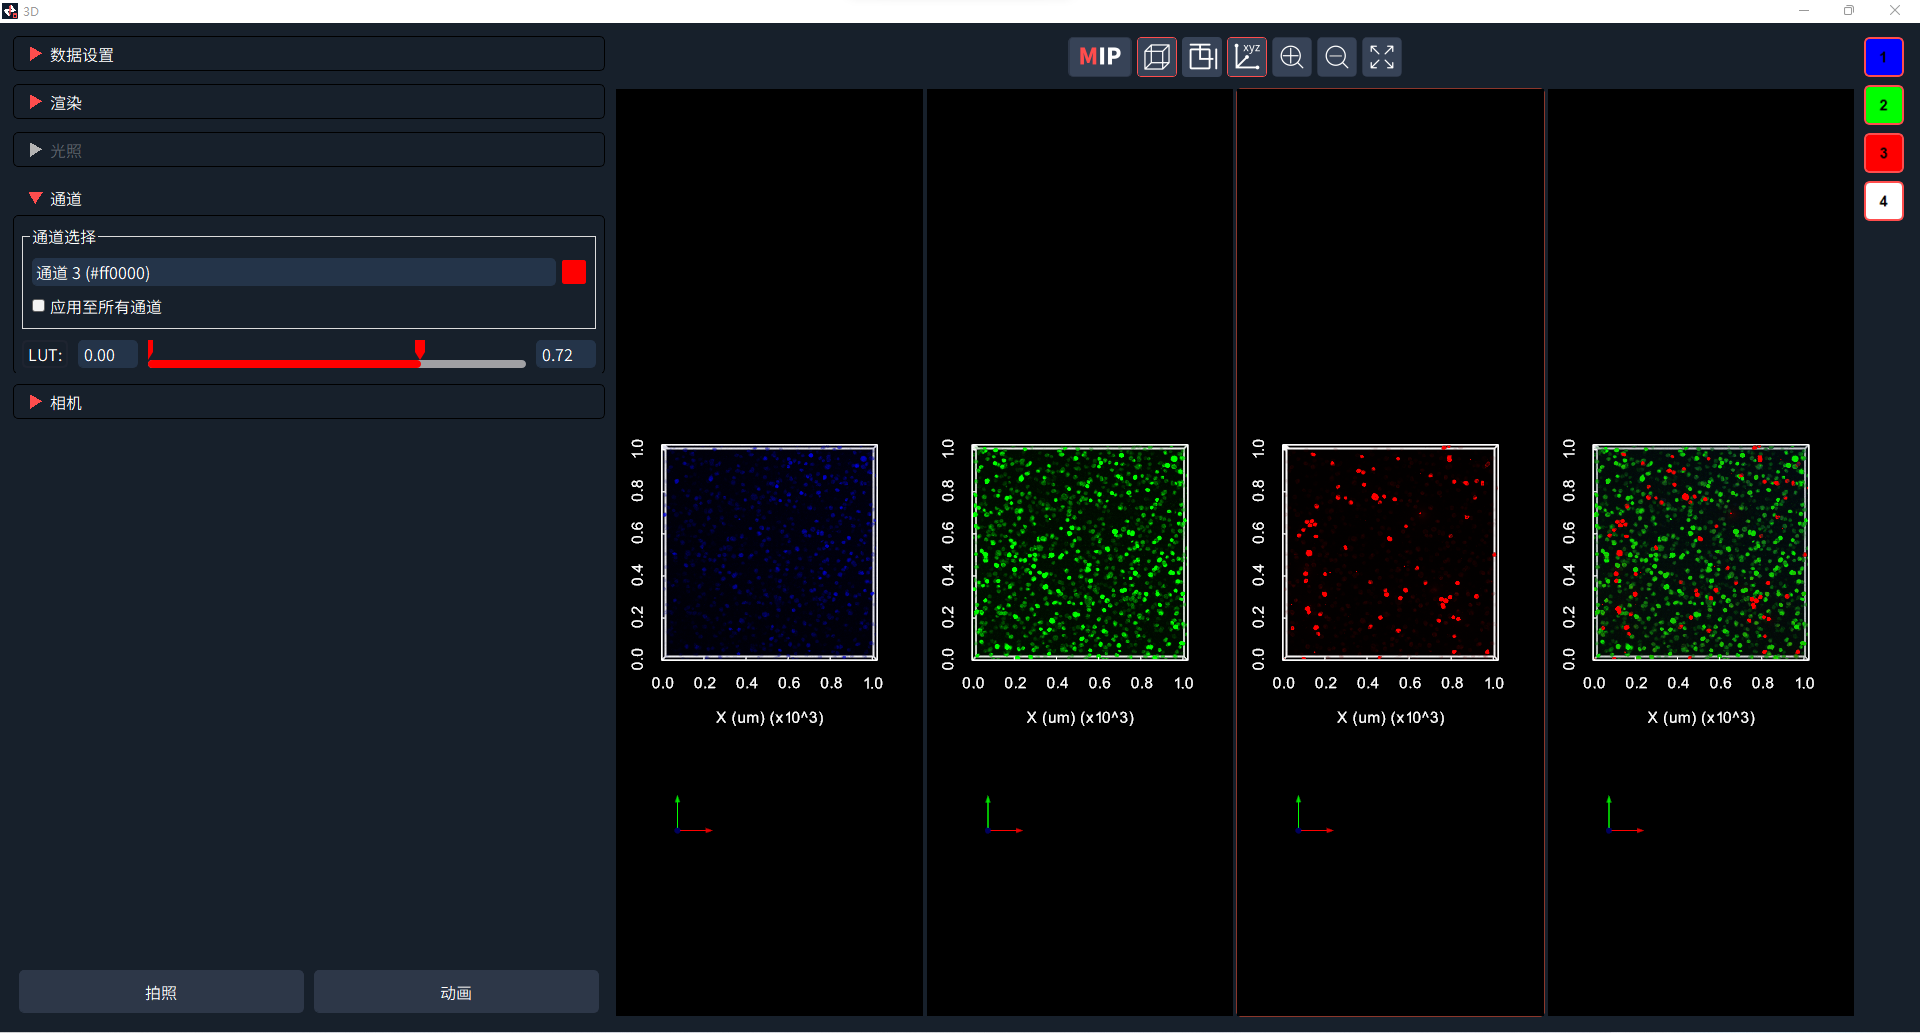
- Within the 3D‑visualization panel, LUT adjustment for each channel and multi‑angle view display are supported (Figure 10).
Figure 9: Entrance interface for 3D‑image display
Figure 10: 3D‑image display and adjustment interface
III. Common Experimental Issues
Q1: How to acquire comprehensive confocal fluorescence images when using two fluorophores with closely‑spaced excitation and emission bands?
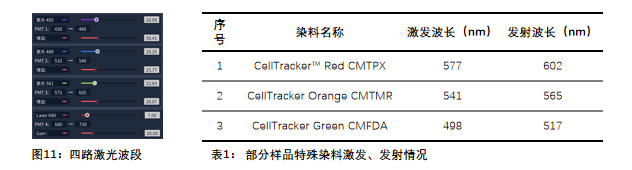
A1: The NCF1000 laser confocal microscope is equipped with four standard excitation channels (405 nm, 488 nm, 561 nm, 640 nm) and four detection channels, which are suitable for fluorophores with well‑separated excitation and emission bands, yet not for special dyes (Figure 11). For multiple fluorophores with adjacent excitation‑emission bands (Table 1), the NCF1000 equipped with a spectral module is required to decompose target detection bands for full retrieval of fluorescence information.
Q2: Is channel‑specific LUT adjustment available during 3D‑image observation?
A2: Import 3D‑scan images into offline NomisPro X‑V software and click the “3D” button on the right‑hand panel to launch 3D rendering. Select individual channels for independent LUT adjustment, then export images or videos as required.
Figure 12: Channel‑LUT adjustment interface for 3D visualization

 Products