I. Experimental Scenario: Observation of Candidate‑drug Inhibition against Escherichia coli and Staphylococcus aureus
1.1 Escherichia coli and Staphylococcus aureus
Escherichia coli and Staphylococcus aureus are two common bacterial species in medicine and microbiology. As a representative Gram‑negative bacterium, E. coli possesses a complex cell‑wall structure with outer membrane and lipopolysaccharides, similar to many pathogenic bacteria such as Salmonella and Shigella. Research on its antibacterial mechanism helps elucidate drug actions against Gram‑negative bacteria. As a typical Gram‑positive bacterium, S. aureus has a thick peptidoglycan‑rich cell wall shared with Streptococcus pneumoniae and Enterococcus. Studies on its inhibition provide references for treating Gram‑positive bacterial infections. Owing to their representativeness, clinical relevance, experimental accessibility and research continuity, E. coli and S. aureus serve as classic model strains for antibacterial‑drug assays. Investigations on these two bacteria enable in‑depth interpretation of antibacterial mechanisms, resistance development and novel antibacterial‑strategy development, providing critical scientific evidence to address global antimicrobial‑resistance challenges.
1.2 Candidate Drug: Porous‑derived Natural Products
Numerous animal tissues in nature contain natural antibacterial components, including antimicrobial peptides (defensins, cathelicidins, etc.), lysozyme, lactoferrin and immunoglobulins. As key components of host innate immunity, these substances exert direct inhibitory effects against bacteria, fungi and even viruses. Existing studies confirm abundant antibacterial substances in porcine tissues. Porcine‑derived defensins achieve broad‑spectrum antibacterial activity by disrupting bacterial cell membranes. Besides, HMGN2 protein, lactoferrin and lysozyme have also demonstrated favorable bacteriostatic effects. As an economically‑important livestock species, pigs supply low‑cost tissue samples (blood, organs, secretions, etc.) readily available from slaughterhouses and farms, showing high value for application development.
1.3 Observation Objectives
- Study on Drug‑action Mechanism
During drug development, confocal microscopes are applied to assess the viability status of E. coli and S. aureus. The ratio of live‑to‑dead bacteria is quantified to evaluate the bacteriostatic efficacy of candidate drugs.
1.4 Viability Observation of Escherichia coli and Staphylococcus aureus
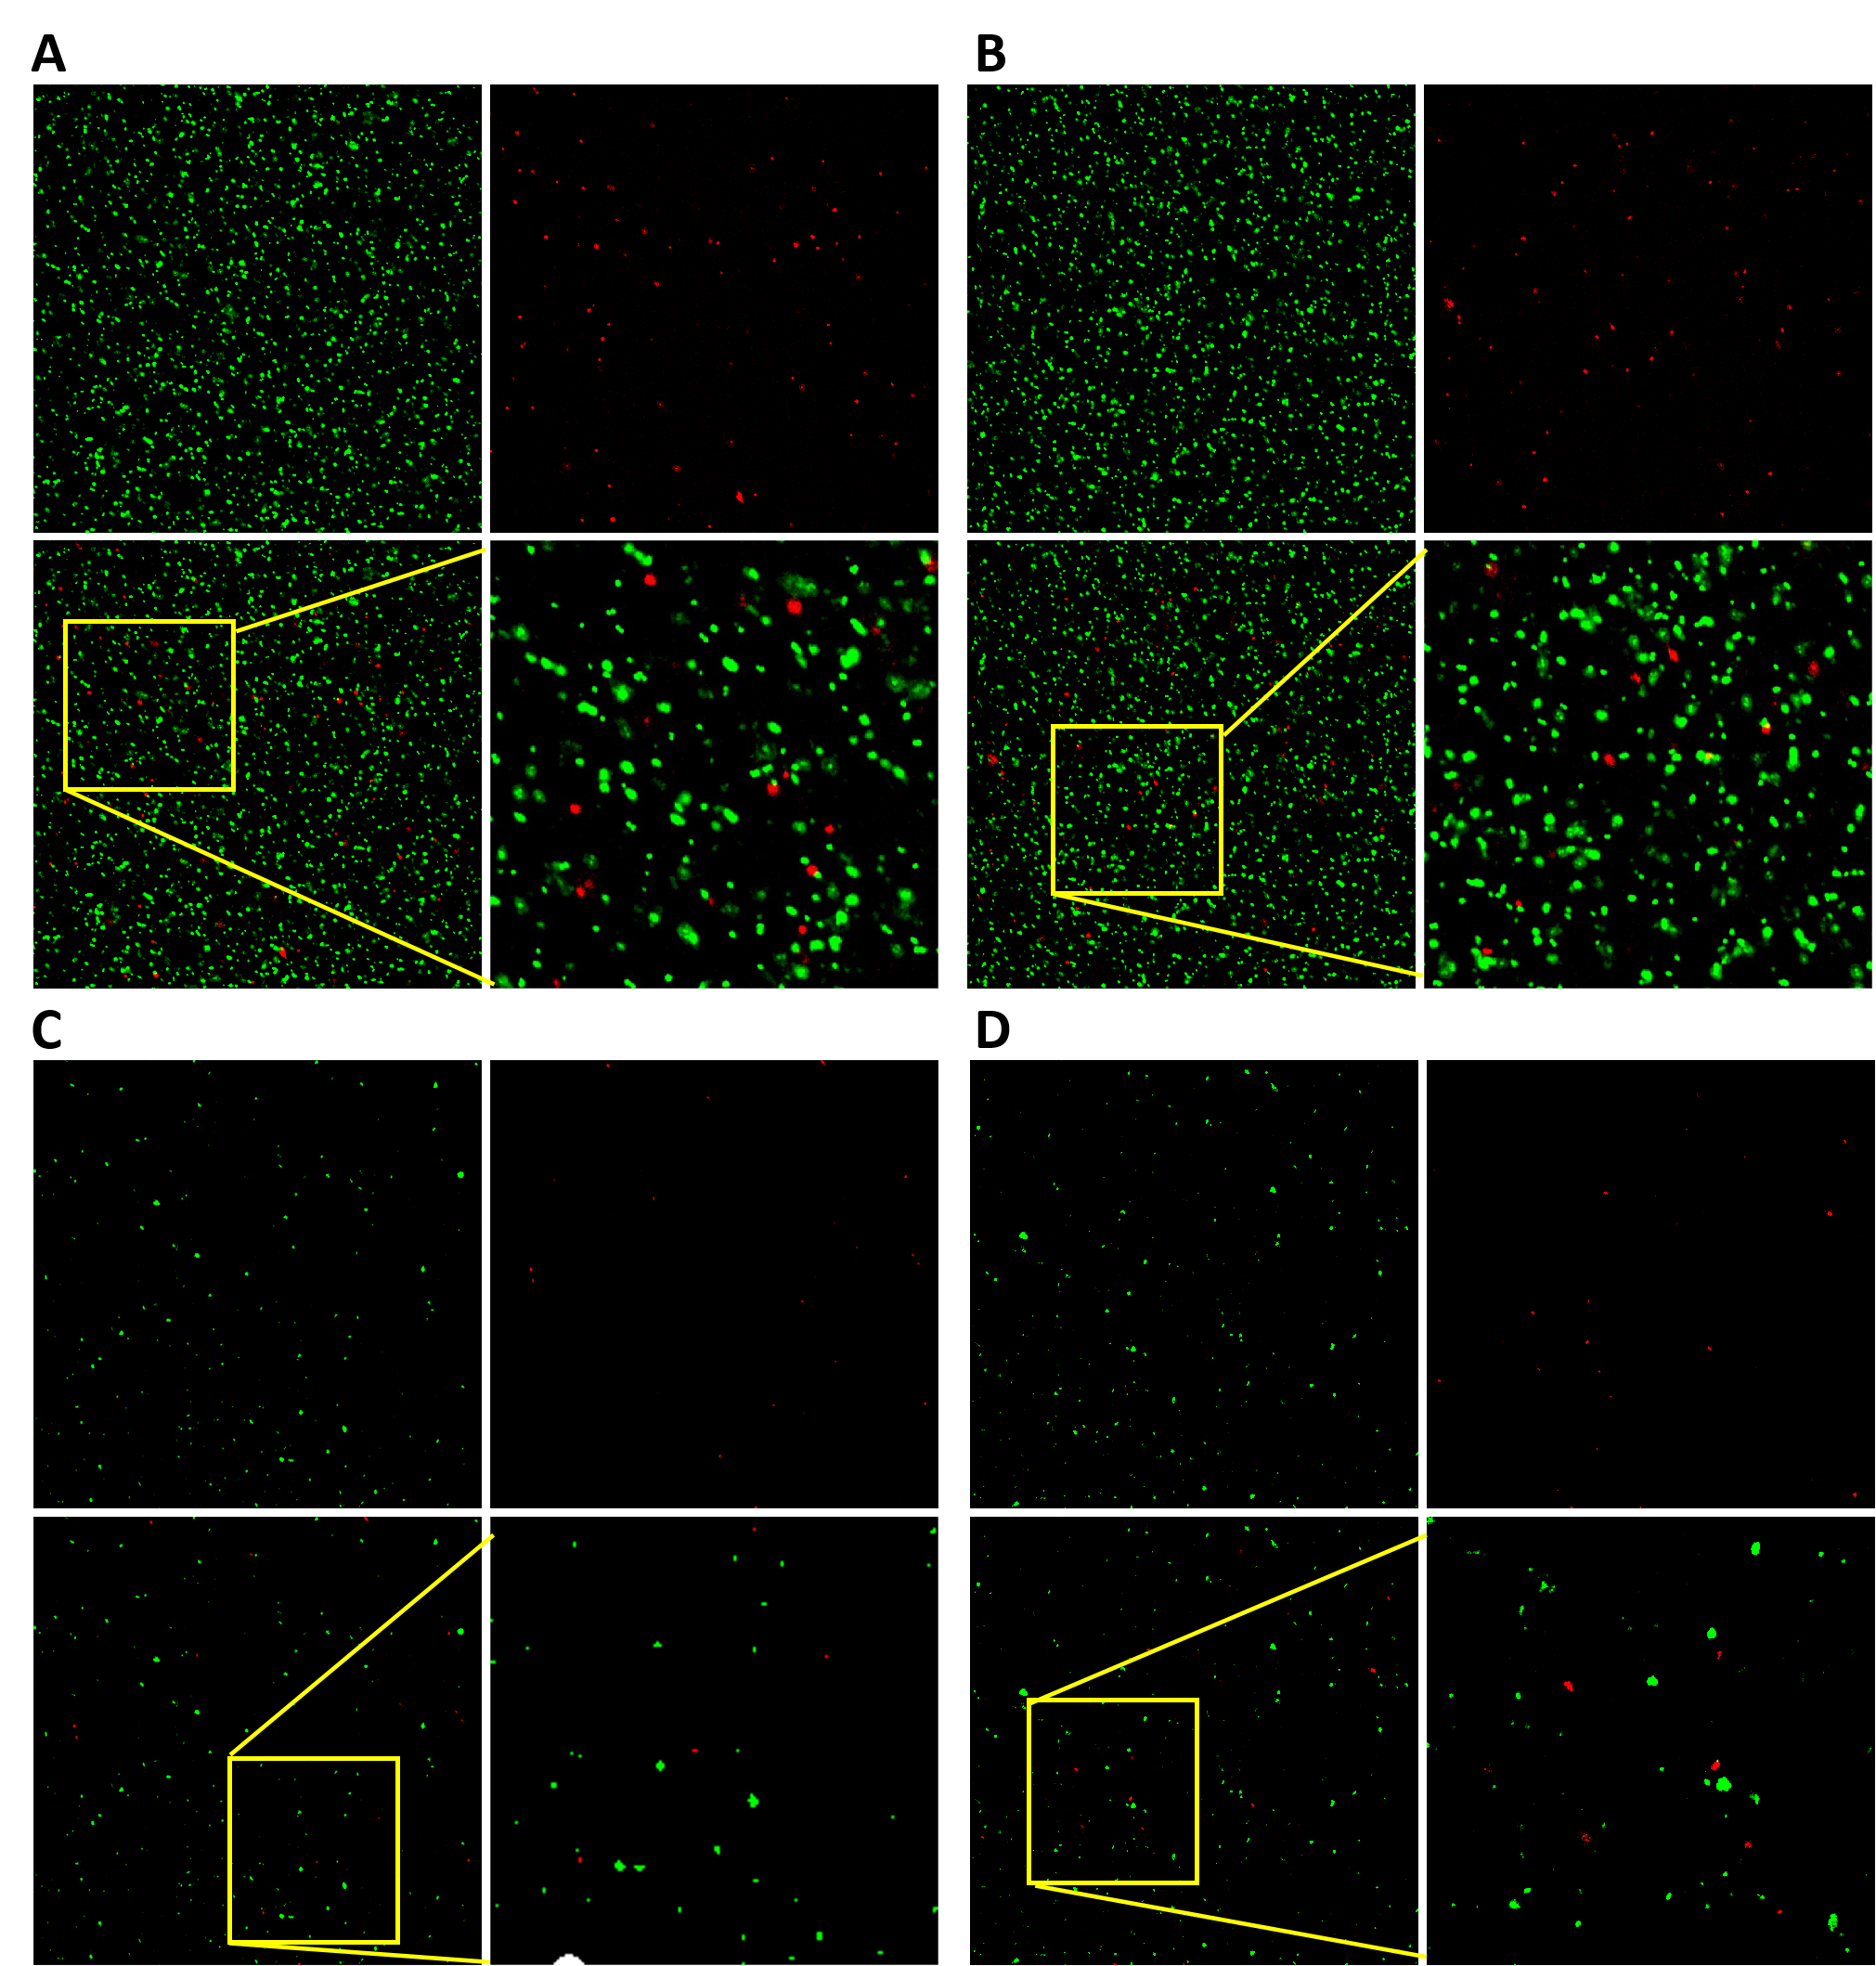
In this experiment, the SYTO 9/PI Live/Dead Bacterial Double Stain Kit was adopted. SYTO 9 (green nucleic‑acid dye) labels live bacteria, while propidium iodide (PI, red fluorescent nucleic‑acid dye) labels dead bacteria (Figure 1). The NCF1000 confocal microscope with a 60× high‑magnification apochromatic objective and 488 nm & 561 nm excitation channels was used for qualitative viability observation of S. aureus and E. coli.
Figure 1: Viability difference of S. aureus / E. coli treated with porcine tissue captured by NCF1000: S. aureus viability (A, B); E. coli viability difference (C, D). Imaging conditions: NCF1000 confocal microscope, 60× NA=1.42 objective, 2048 × 2048 resolution, time‑sequential scanning for 488 nm and 561 nm dual channels.
II. How the NCF1000 Confocal Microscope Supports the Experiment
2.1 Multi‑site Scanning
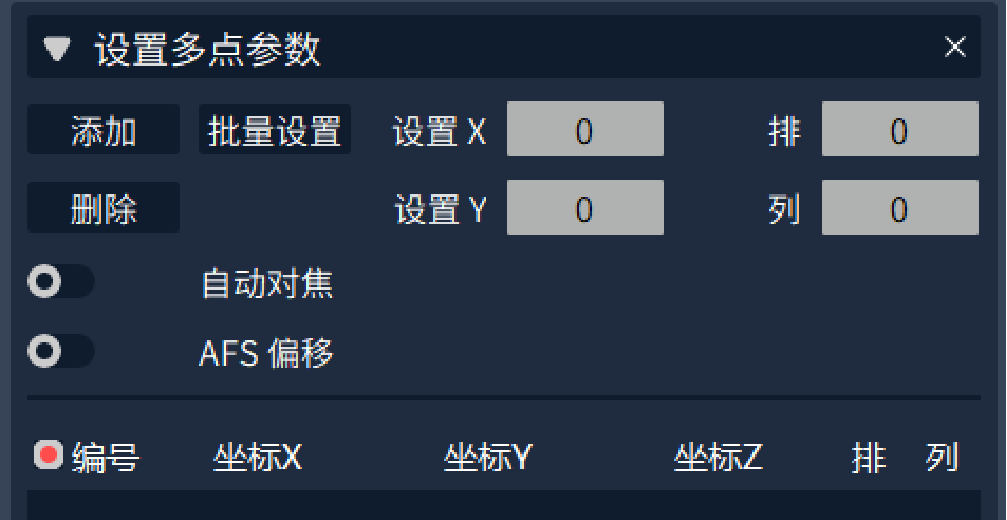
Multi‑site scanning (Figure 2) enables acquisition of multiple fields‑of‑view on one slide under identical settings including laser power, gain, pinhole size and resolution. It improves operational convenience and supports direct multi‑region comparison.
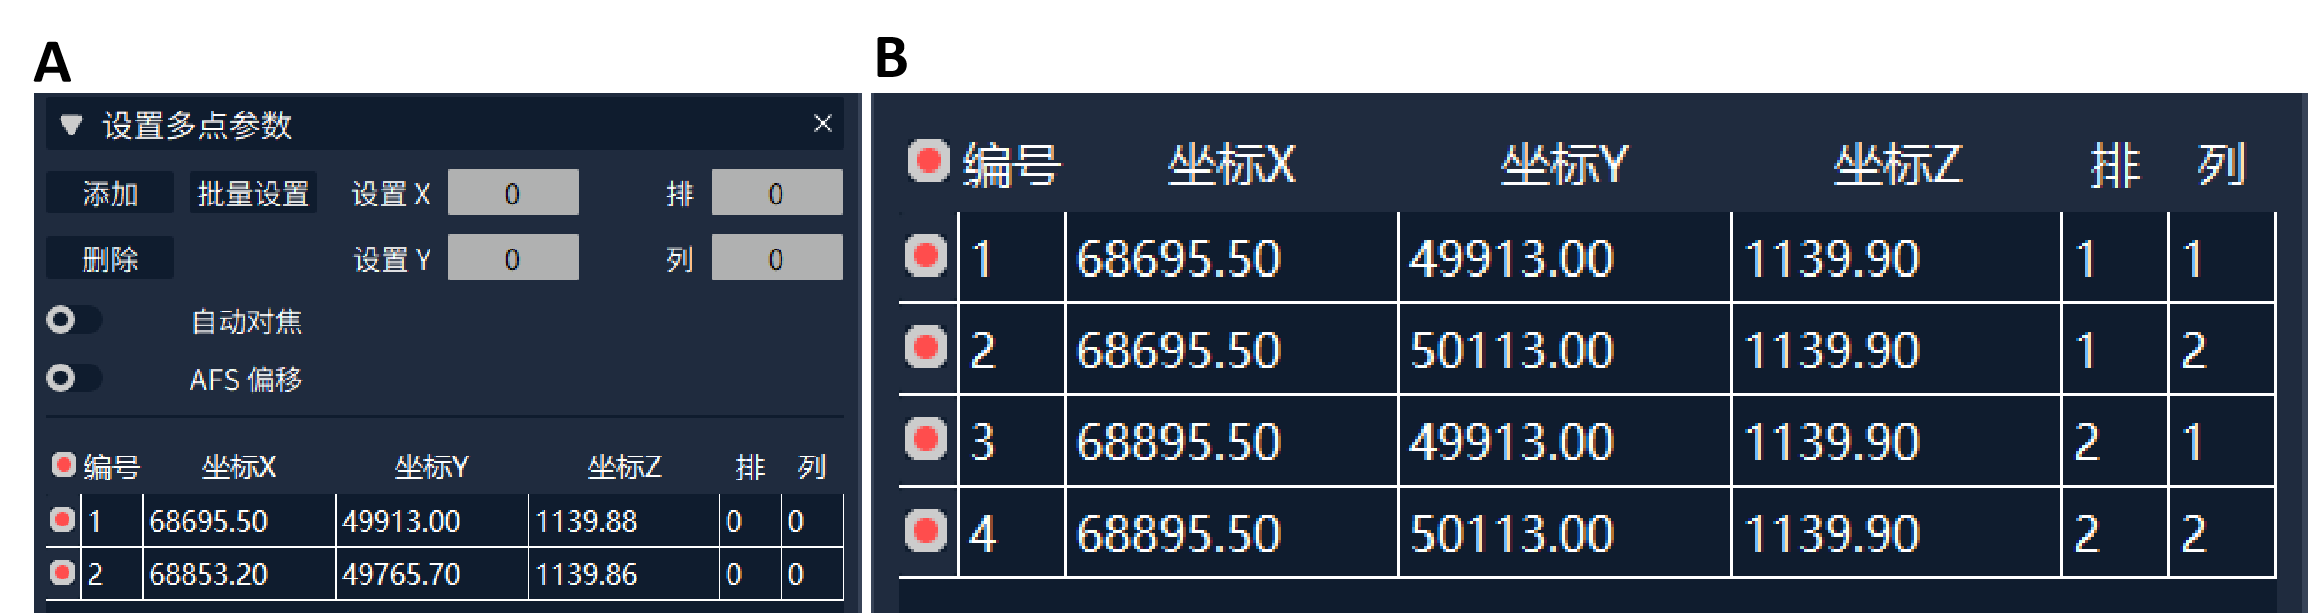
Two position‑setting modes are available: manual coordinate addition and batch coordinate import based on array count and spacing (Figure 3). Multi‑site scanning stores center‑of‑view coordinates covering X, Y and Z axes. For scattered individual cells, multi‑site scanning can be combined with ROI cropping for single‑cell‑oriented multi‑position acquisition.
After adding positions, double‑click coordinate entries to drive stage movement for field‑of‑view re‑verification.
Figure 2: Multi‑site scanning setting interfaceScan
Mode 1: For comparative observation across multiple regionsScan
Mode 2: For dense‑sample applications targeting cell‑count statistics
Figure 3: Two multi‑site‑scanning modes: manual coordinate addition (A); batch‑import position mode (B)
2.2 Cell Counting
- The NCF1000 provides cell‑counting functionality (Figure 4) for automated counting of multiple cell groups. Select the cell‑count tool in the measurement panel, click on cells in the image to mark targets, right‑click to finish one counting batch, and the corresponding cell number will be generated automatically.
Figure 4: Cell‑counting tool
2.3 Image Brightness Adjustment
Main functions of LUT adjustment:
1. Brightness adjustment: Enhance or suppress image contrast via non‑linear mapping to highlight target features.
2. Background‑noise reduction: Compress the grayscale range of background noise while preserving target‑signal details by tuning the LUT mapping curve.
*Note: Maintain a ratio ≥10 between brightness value and denoising value to prevent loss of valid signals.
III. Common Experimental Issues
Q1: How to handle weak sample fluorescence and high background noise?
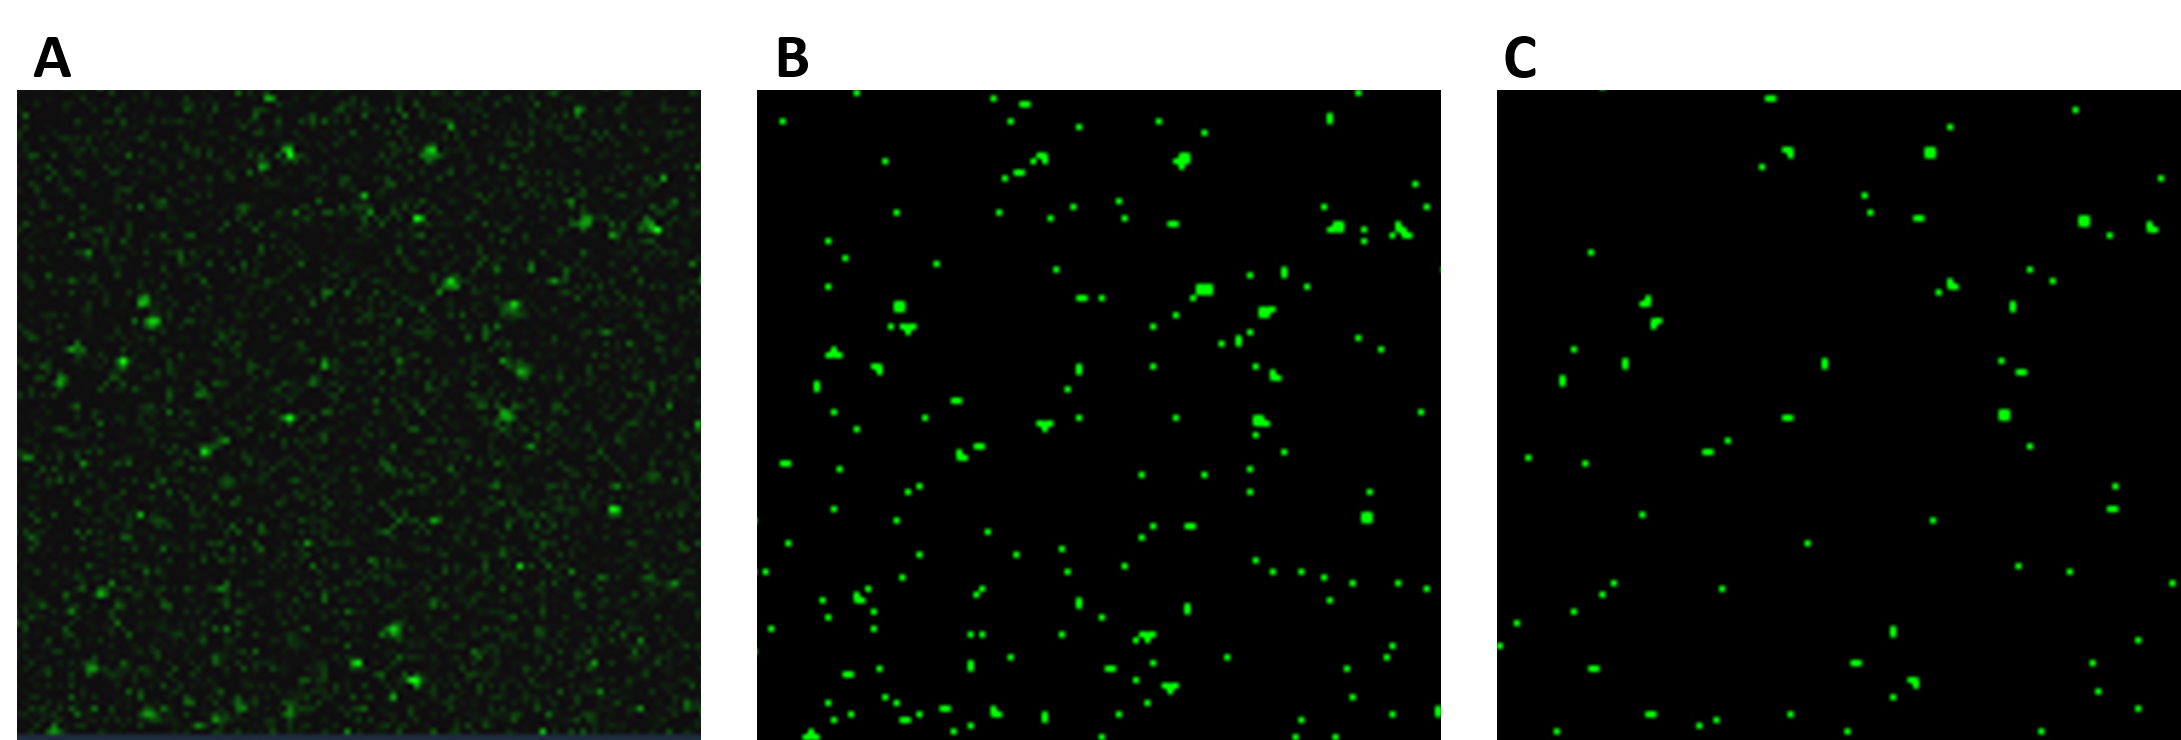
A1: Verify the pinhole size (default: 1 AU). Adjust laser power to 20‑30 % and gain to 40‑50 %; moderately increase pinhole size if needed. If the image remains dim, apply LUT adjustment: raise brightness to amplify sample signals and enable denoising to suppress background for clear sample visualization.Figure 5: Image processing via LUT adjustment: raw captured image (A); image after LUT brightness tuning (B); image after LUT denoising (C)
Figure 5: Image processing with LUT adjustment: raw captured image (A); image after LUT brightness adjustment (B); image after LUT‑based denoising (C)
Q2: Poor signal‑to‑noise ratio; noise cannot be distinguished from sample signals. How to solve it?
A2: Turn off laser excitation for the target channel, enable gain only and set gain to the acquisition level. Switch LUT to auto mode and record LUT values for all channels to be imaged. Before formal acquisition, switch LUT to manual mode and input the recorded values into the denoising parameter of each corresponding channel to eliminate intrinsic amplifier‑circuit noise.

 Products