I. Experimental Scenario: Determination of Target‑protein Location via Tobacco Subcellular Localization
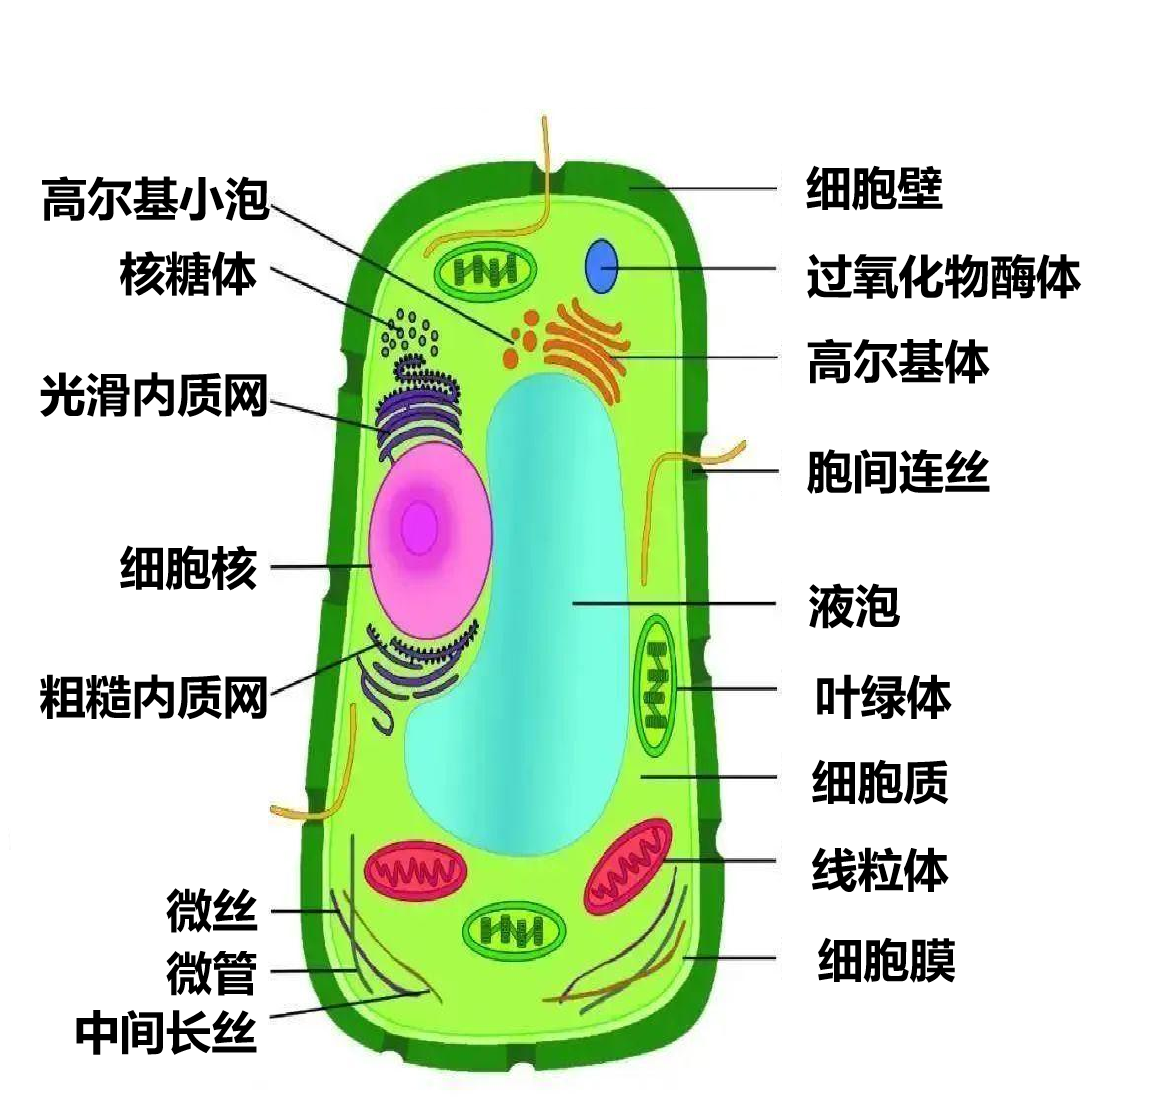
1. Subcellular Localization enables mapping of proteins or gene expression products to specific cellular compartments such as the nucleus, various organelles and plasma membrane, providing research clues for deciphering gene action mechanisms.
Figure 1: Structural diagram of plant cell
2. Nicotiana benthamiana, an allotetraploid species of the Solanaceae family, has a genome consisting of 19 chromosomes. Owing to multiple advantages, it is widely used in protein subcellular localization, protein‑protein interaction assays and biopharmaceutical production. It features compact plant size with large, luxuriant leaves and a short cultivation cycle, and is easy to grow under laboratory conditions for bulk sample collection. As a model plant, it supports in‑planta gene‑expression regulation and protein post‑translational modification, making it more suitable for heterologous‑gene functional verification than E. coli or yeast.
3. In this experiment, Agrobacterium‑mediated transient expression in tobacco was adopted to observe Yellow Fluorescent Protein (YFP) localization within tobacco leaf cells. The 20× objective was selected to acquire sufficient field‑of‑view and clear images. Under confocal mode, overlay of transmitted‑light and fluorescence channels visualizes the spatial correlation between plant tissue architecture and fluorescent signals more intuitively.
- Target‑protein Subcellular Localization in Tobacco Leaf Cells
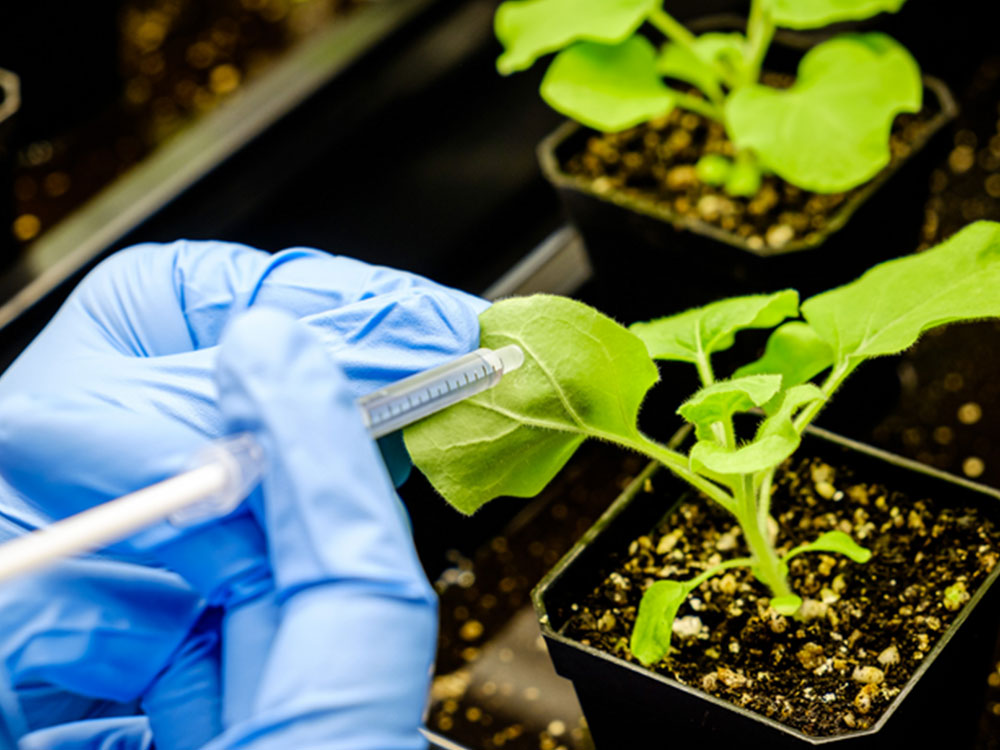
At sample‑preparation stage, fresh young tobacco leaves were infiltrated with Agrobacterium suspension carrying target‑gene constructs. After incubation, marked leaf regions were excised for observation.
Figure 2: Nicotiana benthamiana infiltrated with Agrobacterium suspension
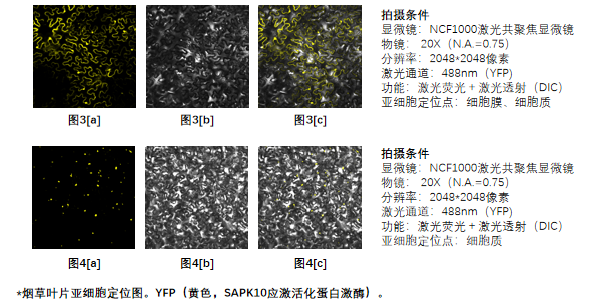
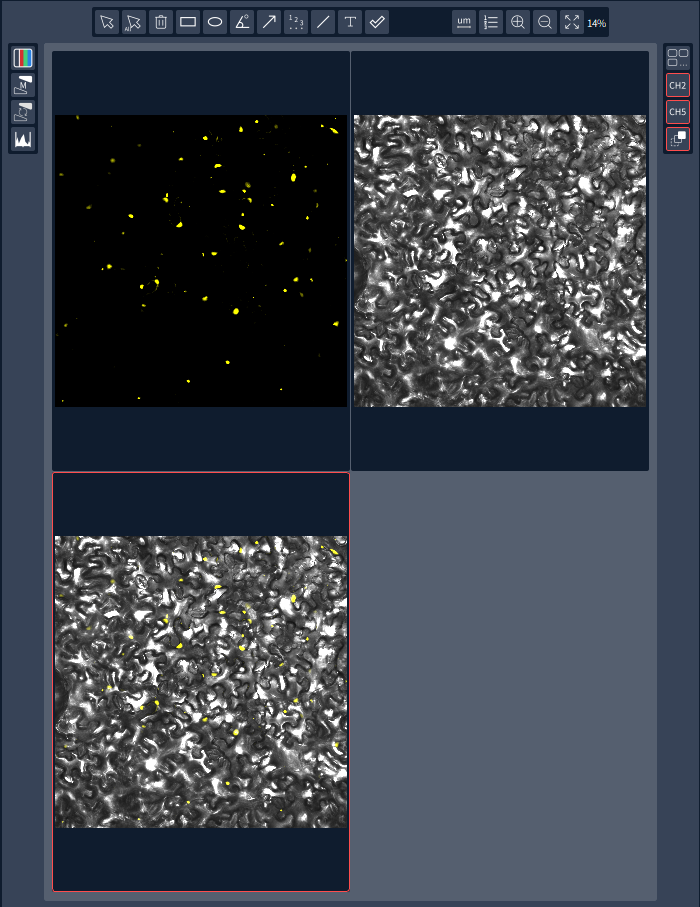
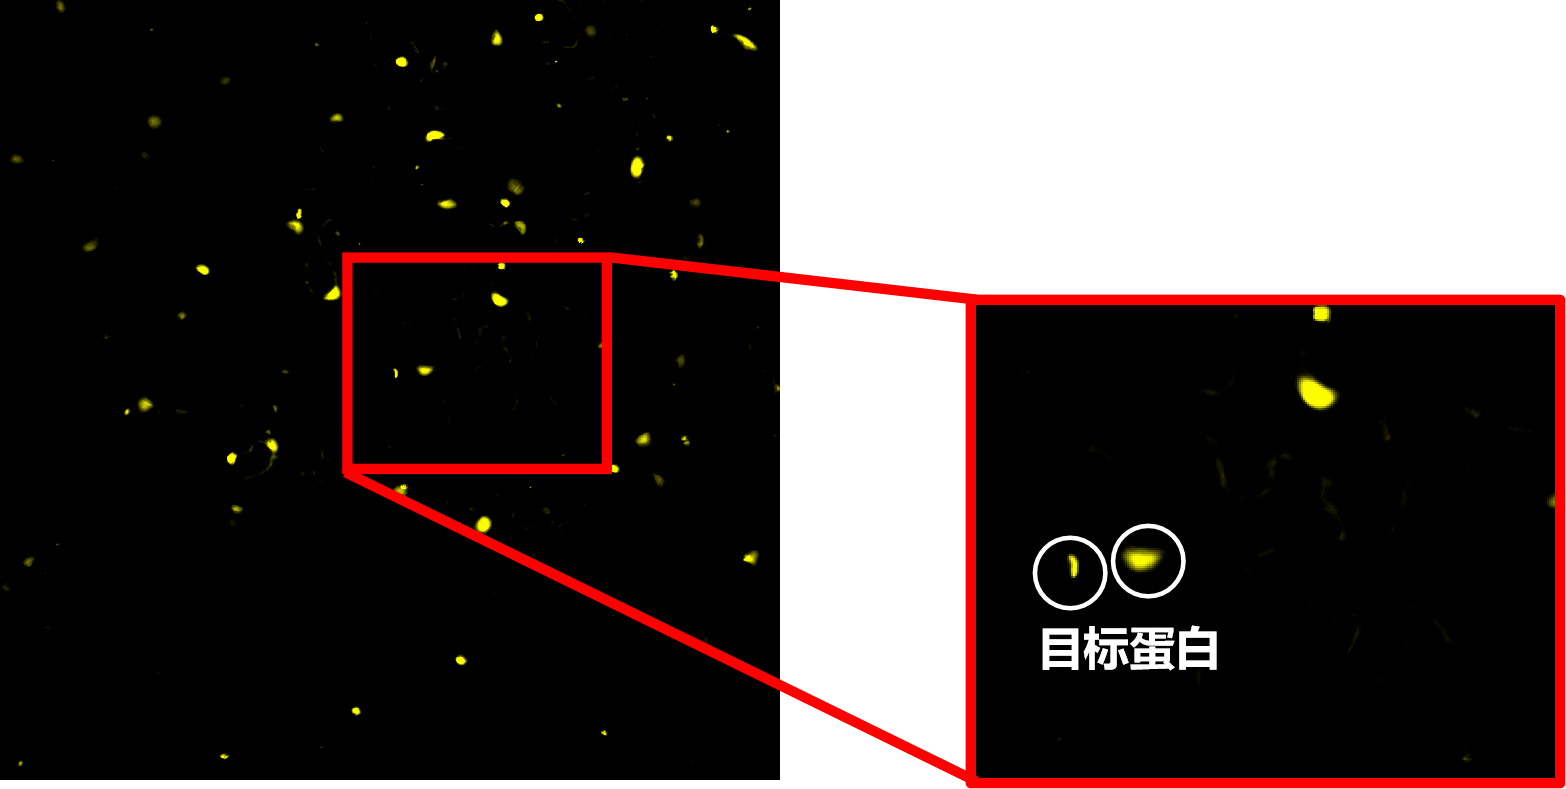
This experiment investigates the subcellular distribution of stress‑activated protein kinase SAPK10 in tobacco leaf cells. Tobacco leaf surfaces have complex textures. Overlay of DIC and fluorescence channels preserves surface morphological features while capturing fluorescent signals, enabling accurate subcellular‑localization confirmation. SAPK10 was tagged with Yellow Fluorescent Protein (YFP). Images acquired under 488 nm excitation require pseudo‑color restoration for YFP visualization.
Images complying with above experimental requirements were obtained, as shown in Figure 3 and Figure 4.
II. How the NCF1000 Confocal Microscope Supports the Experiment
1. Laser Fluorescence plus Laser Transmission (DIC)
- The NCF1000 laser confocal microscope is equipped with four fluorescence channels and one transmission channel to support fluorescence‑DIC overlay.
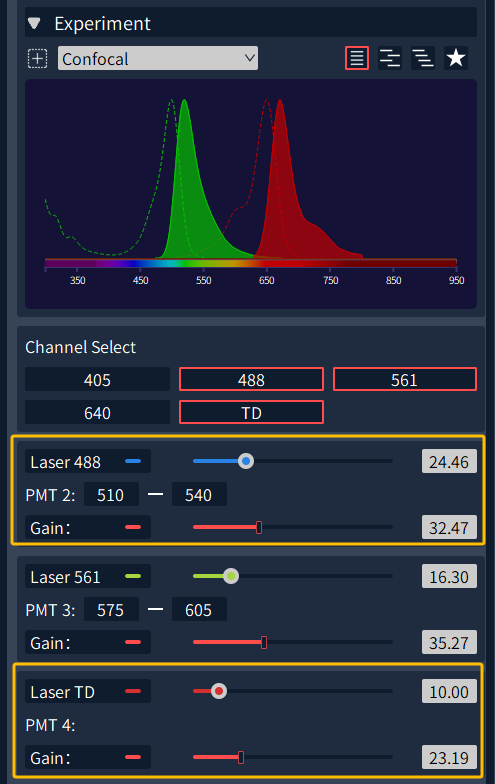
- In NomisPro X‑C software, excitation power and gain for fluorescence and transmission channels can be adjusted independently, and channel‑overlay effects can be previewed in real time (Figure 5, Figure 6).
Figure 5: Laser‑channel parameter setting panel
Figure 6: Channel display interface
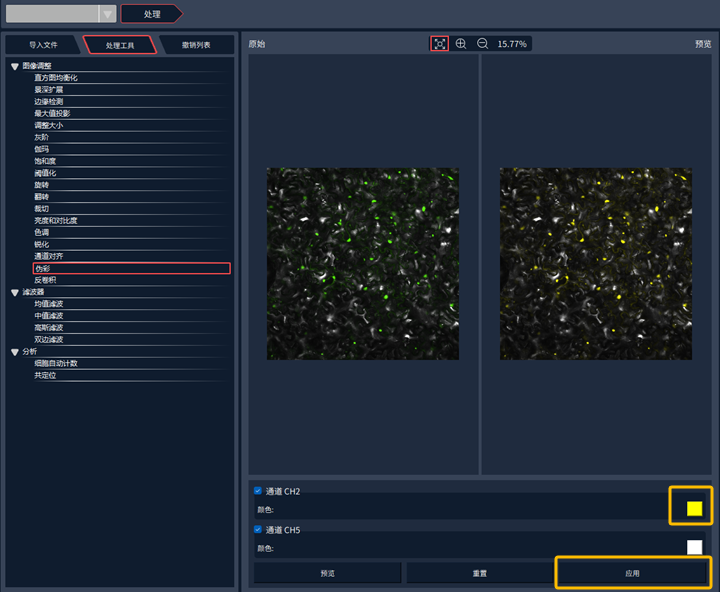
Figure 7: Pseudo‑color adjustment interface of offline software
2. Pseudo‑color Modification for Fluorescence Channels
- The original NomisPro X‑C software and its offline version support pseudo‑color adjustment (Figure 7, Figure 8).
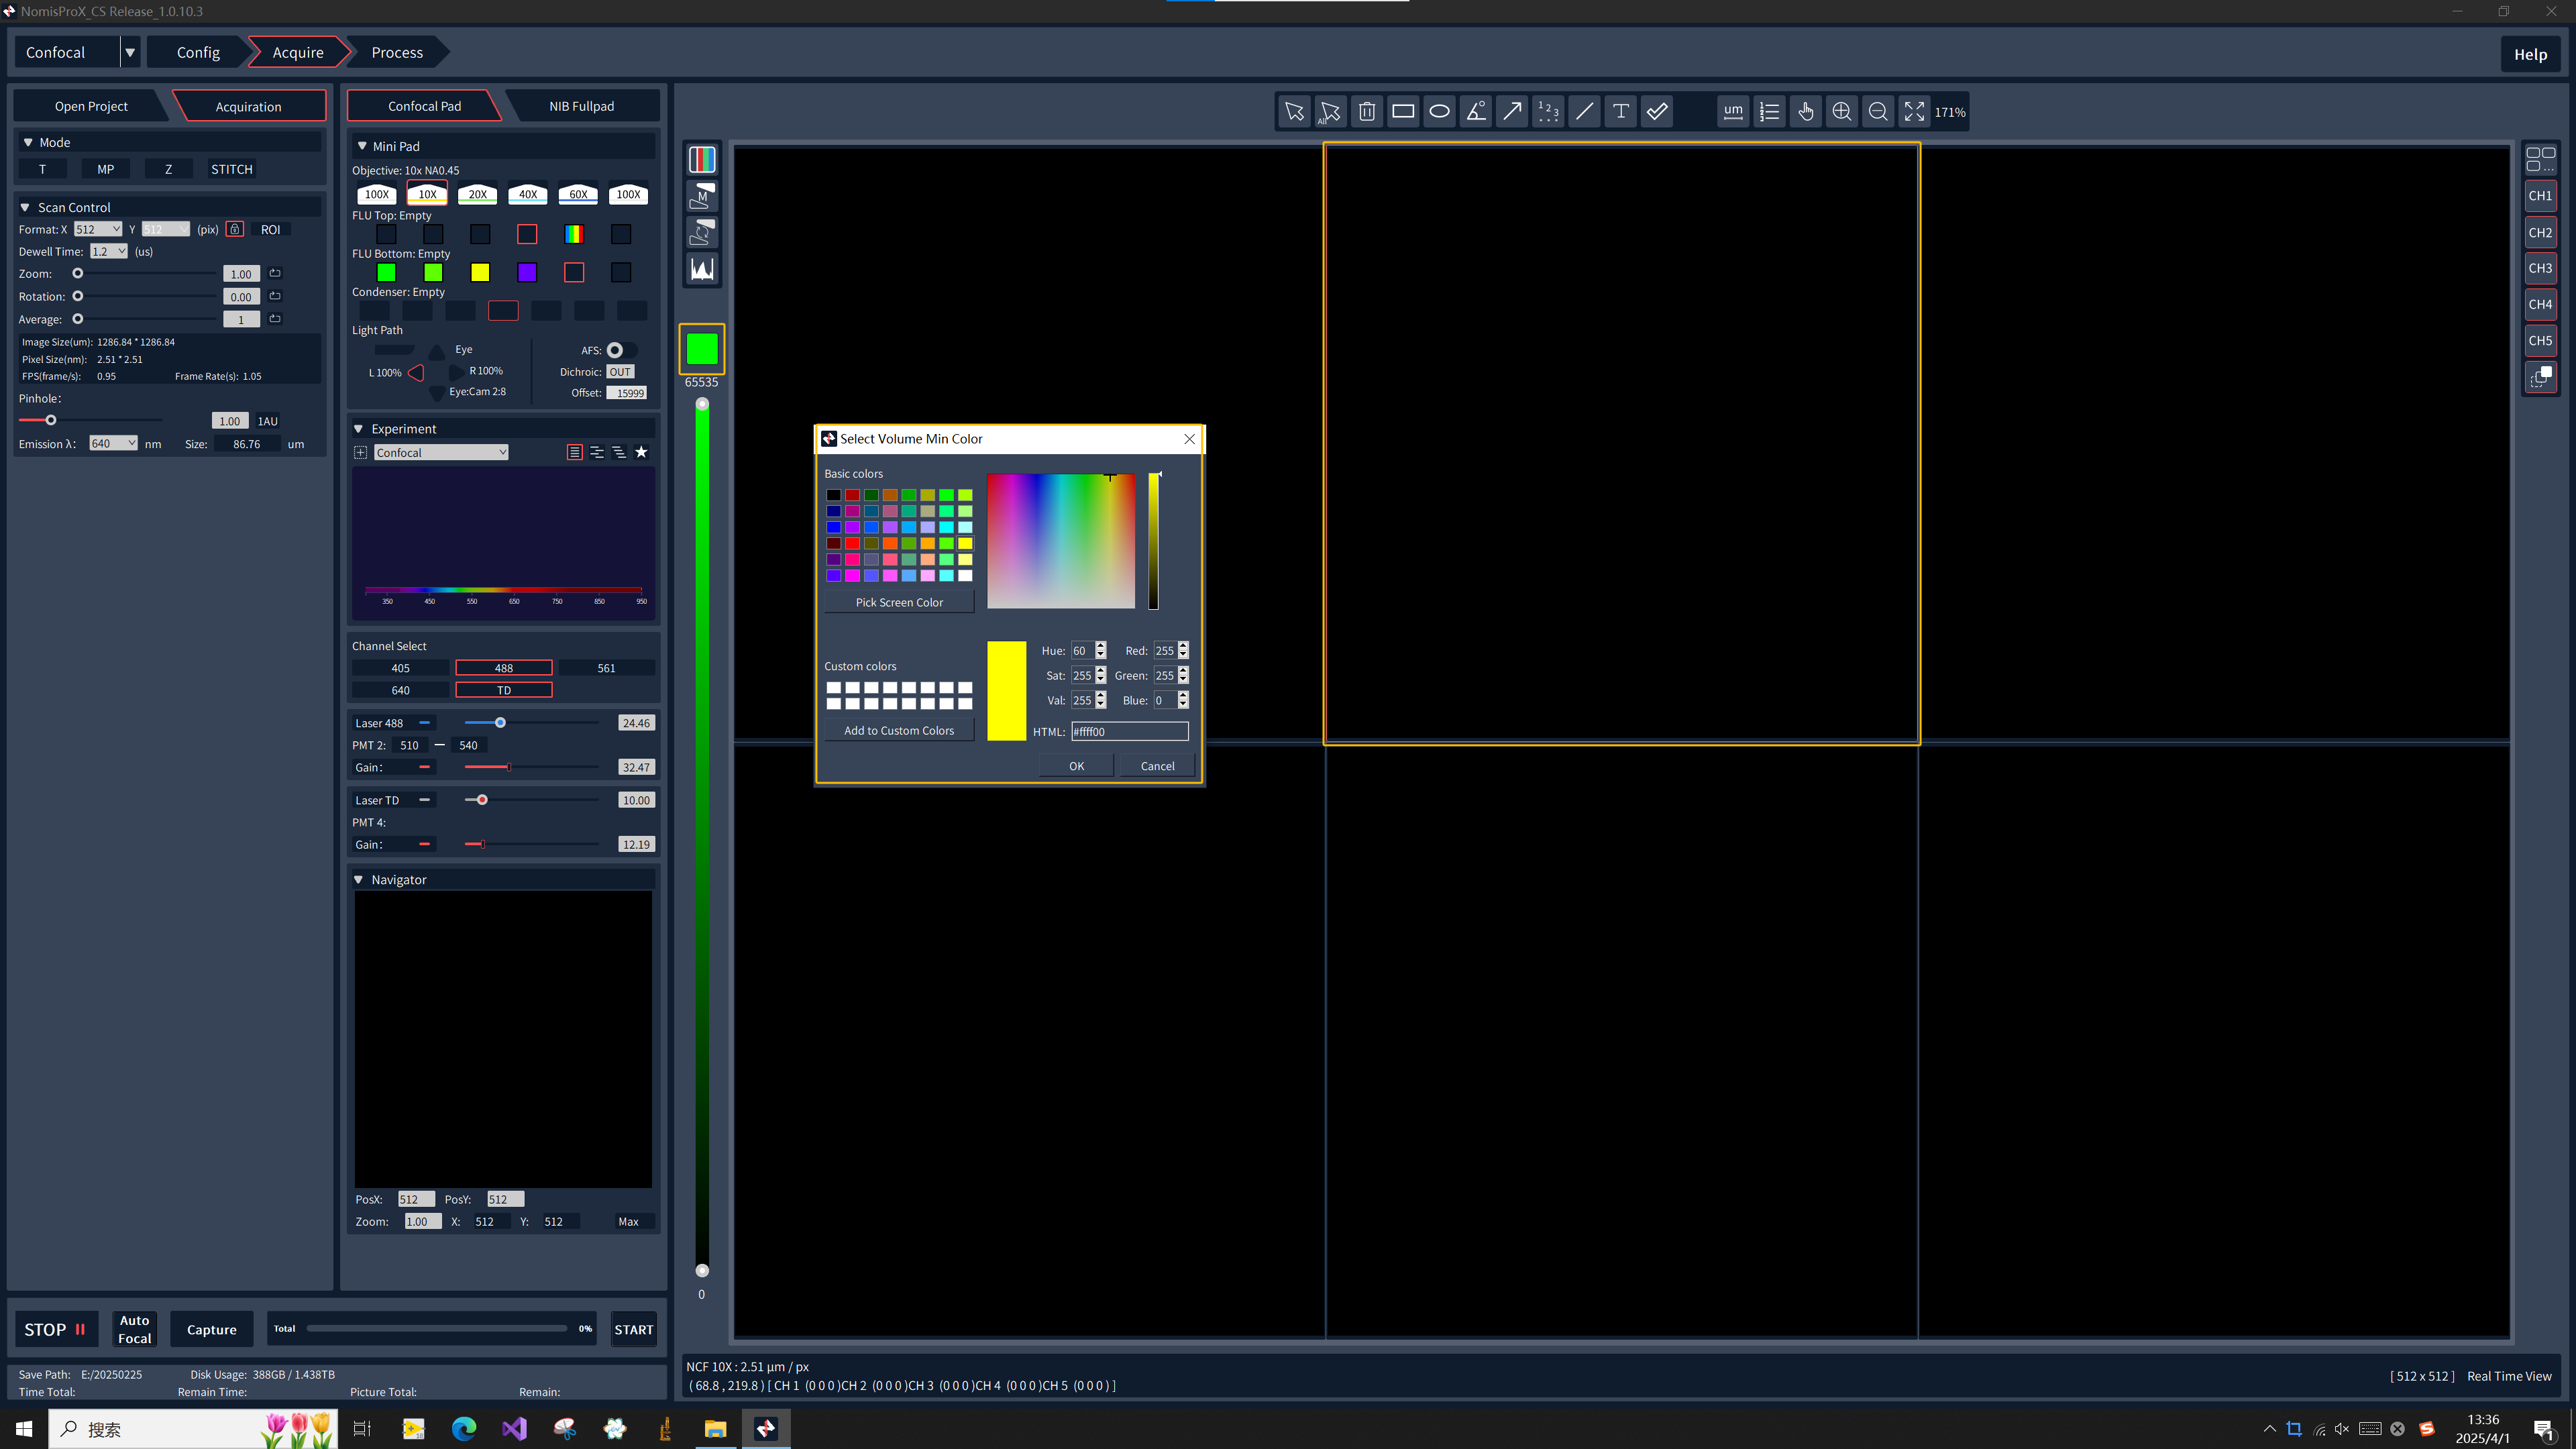
- In this experiment, 488 nm excitation generates default green‑colored signals. The display color can be switched to yellow for overlay visualization without altering raw excitation data.
Figure 8: Pseudo‑color setting panel on NomisPro X‑C image‑acquisition interface
III. Common Experimental Issues
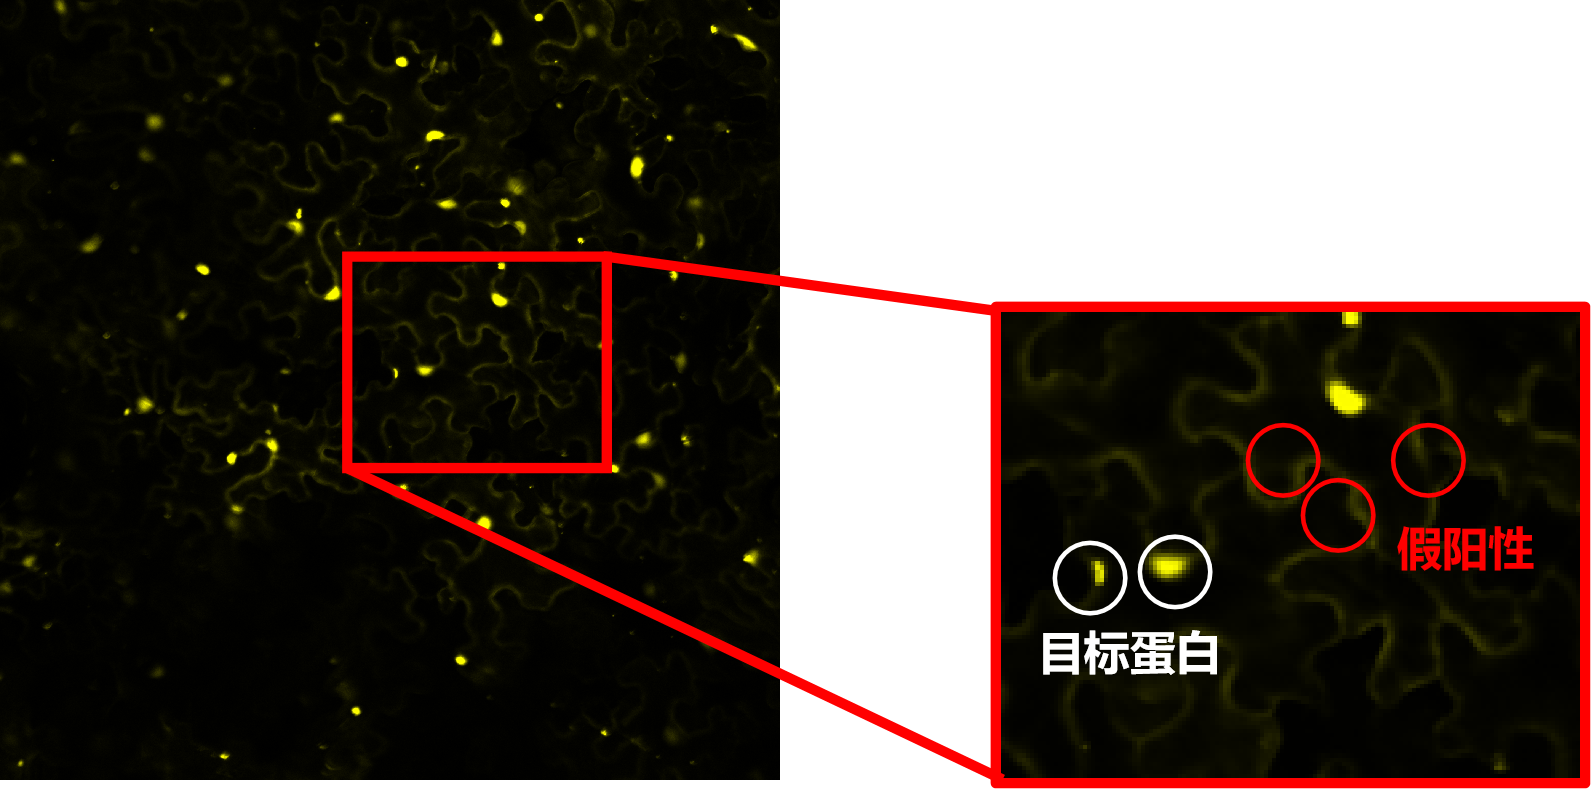
Q1: How to avoid false‑positive fluorescence signals for target proteins in tobacco‑representative plant samples?
A1: First verify the status of infiltrated or labeling reagents (shelf‑life, storage condition, concentration, etc.). If reagents are valid, set laser power ≤35 % and gain ≤50 % on NCF1000; generally keep laser‑power value no higher than gain value. If false‑positive signals still exist while target‑protein signals are distinct, adjust image levels appropriately.
Figure 9: False‑positive fluorescence of SAPK10 stress‑activated protein kinase in tobacco‑leaf subcellular‑localization assay
Figure 10: Fluorescence of SAPK10 stress‑activated protein kinase after level adjustment in tobacco‑leaf subcellular‑localization assay

 Products