I. Experimental Scenario: Co‑localization Analysis of EGFP and mCherry Fluorescent Proteins
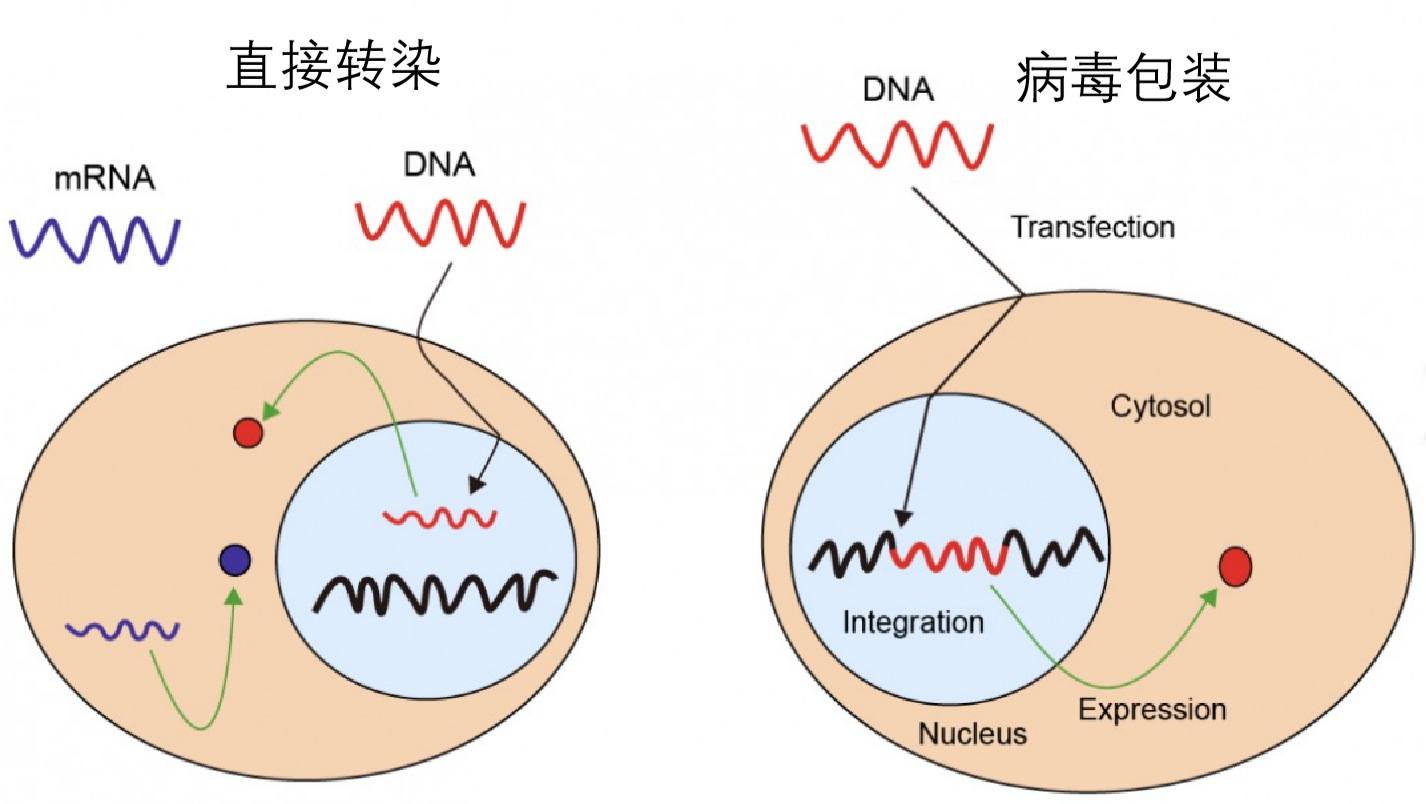
1. Cell transfection is a core technique in molecular and cell biology, which introduces exogenous nucleic acids (plasmid DNA, siRNA, etc.) into eukaryotic cells. It is mainly divided into direct transfection and viral packaging. Direct transfection delivers plasmid DNA directly into cells; it is fast and simple, and commonly used to verify plasmid expression. Viral packaging clones target genes into viral vectors and co‑transfects them into packaging cells. Though workflow‑intensive, it generates stably‑expressing fluorescent‑protein cell lines for long‑term, large‑scale co‑localization studies.
Figure 1: Schematic diagram of cell transfection workflow
2. Fluorescence co‑localization analysis quantitatively evaluates spatial overlap between two distinct fluorescent‑labeled molecules (mostly proteins) inside cells, to infer potential molecular interactions or co‑localization within identical cellular compartments.
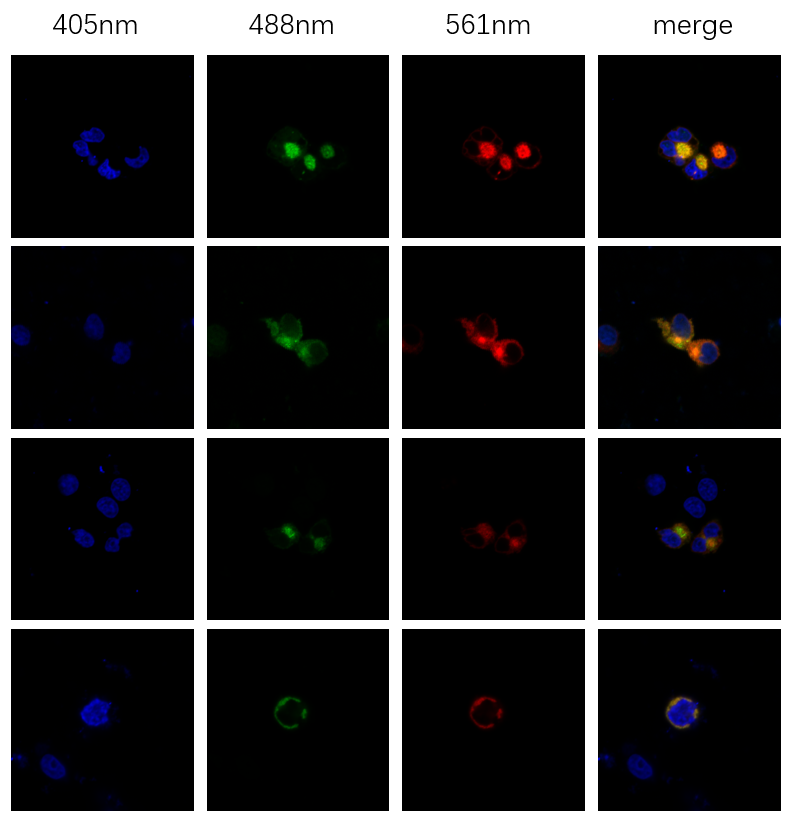
3. In this experiment, plasmid DNA encoding EGFP and mCherry was delivered into 293T cells (human renal epithelial cells) via cell transfection. After plasmid uptake, cells synthesize fluorescent proteins using endogenous expression machinery to label cell membranes. With the NCF1000 laser confocal microscope equipped with a 60× apochromatic objective and high‑power 405 nm, 488 nm, 561 nm laser lines, co‑localization analysis was performed for fluorescent proteins with varied distribution and signal intensity.
II. User Application Results
- Fluorescence Co‑localization Analysis of Different Protein Tags with 60× Apochromatic Objective
The NCF1000 laser confocal microscope with 60× (NA = 1.42) objective was used for co‑localization assay on 293T cells: DAPI‑stained nuclei, EGFP‑ and mCherry‑labeled cell membranes. DAPI is excited at 405 nm with blue emission; EGFP is excited at 488 nm with green emission; mCherry is excited at 561 nm with red emission.
Figure 2: Three‑channel confocal image of 293T cells
- Maximum‑intensity Projection for Visualizing Complete Cell Morphology
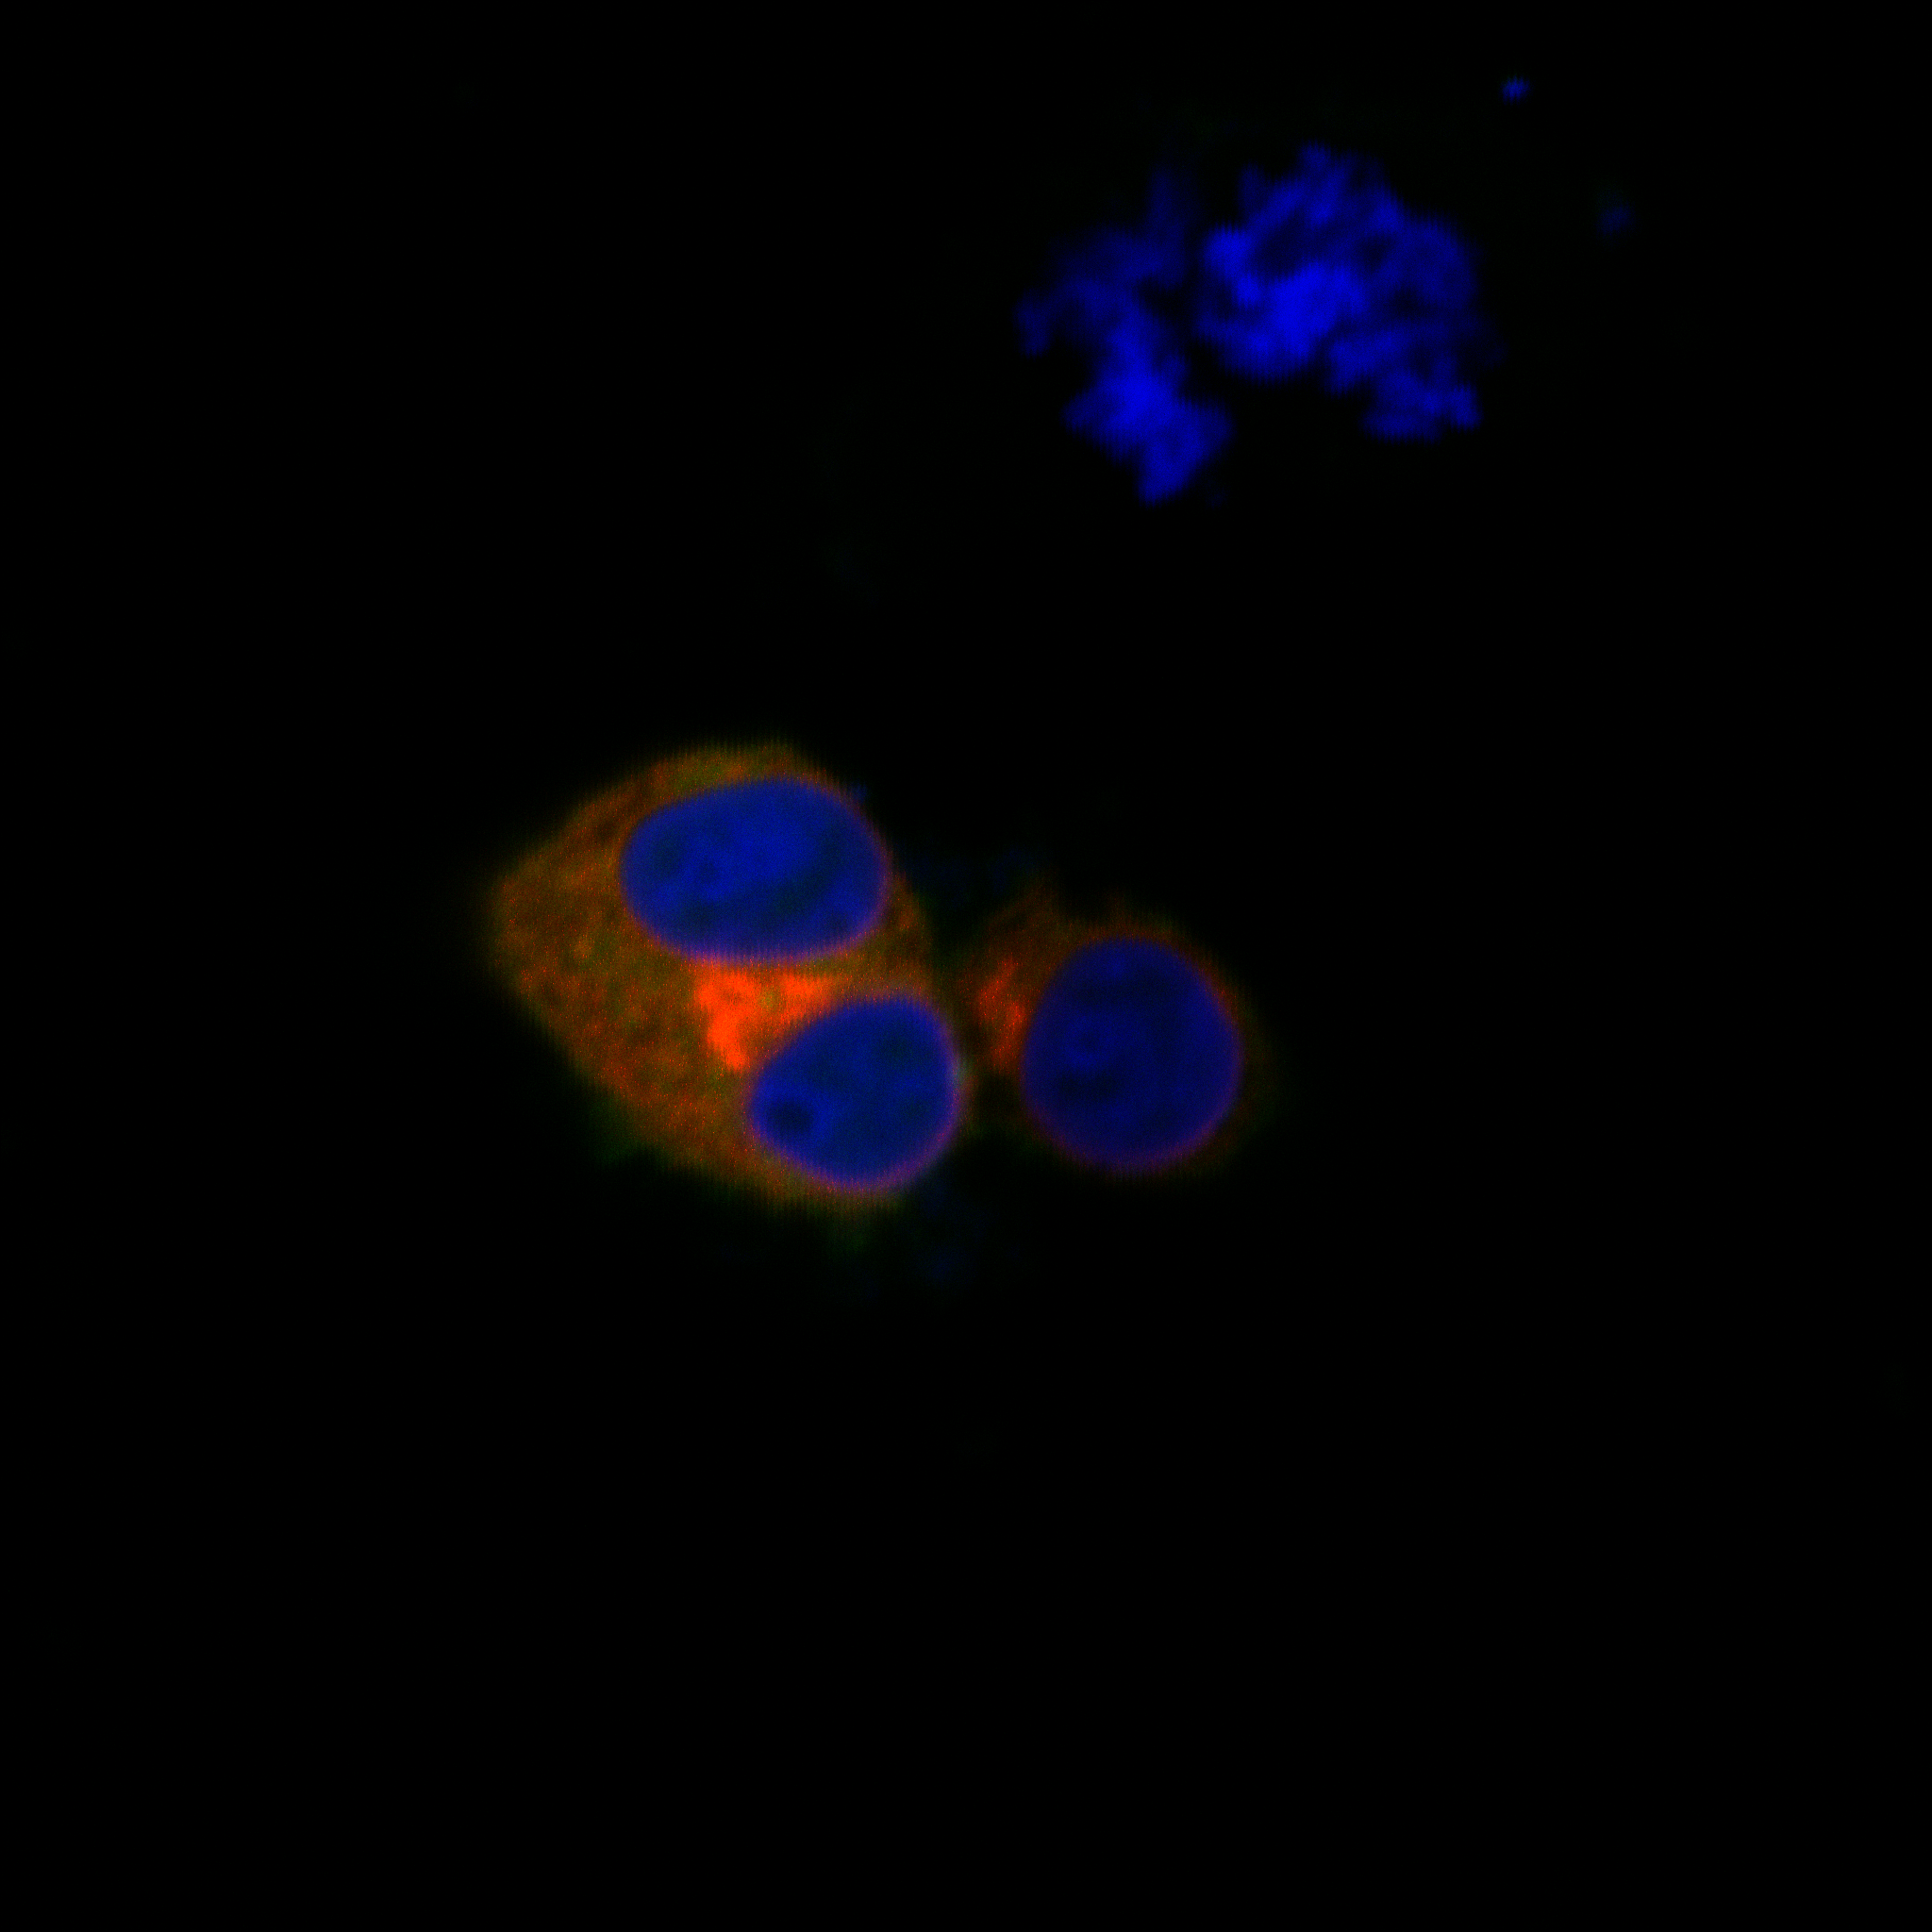
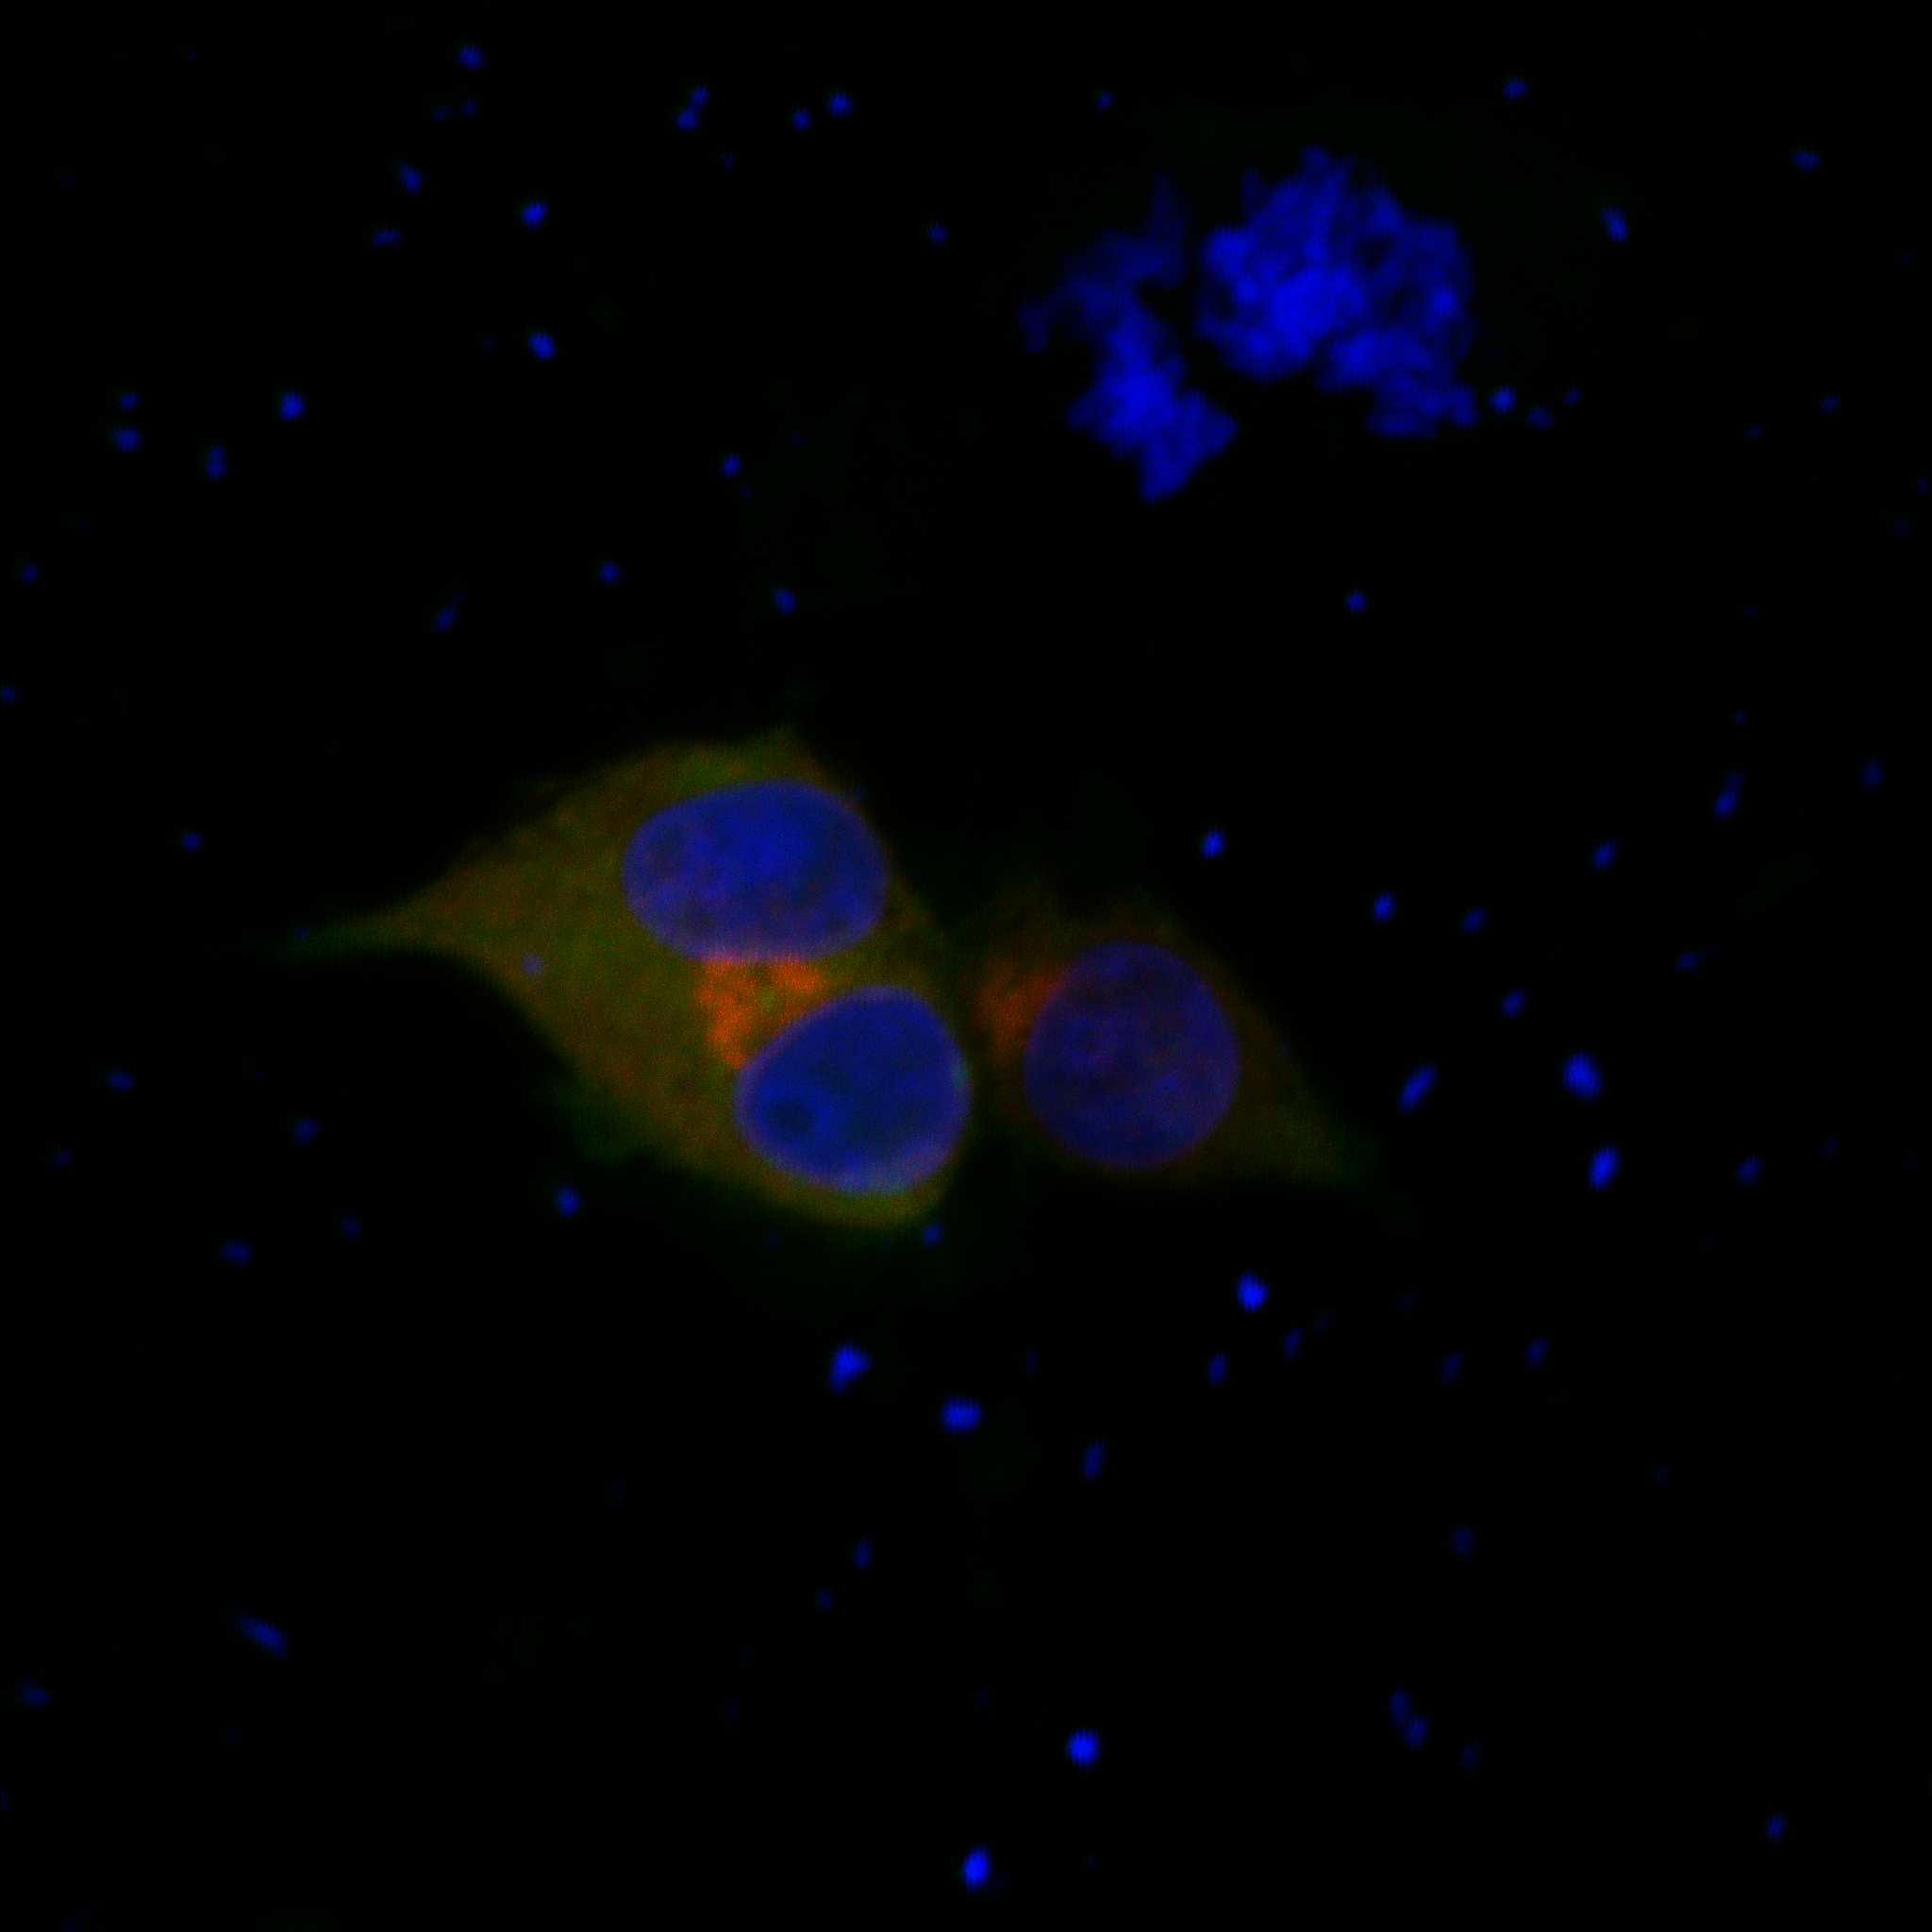
Confocal microscopes have limited depth of field, so cells spanning multiple focal planes cannot be fully imaged in one single slice. The maximum‑intensity projection merges signals from each Z‑slice to reconstruct full cell morphology in one image.
Figure 3: Before maximum‑intensity projection
Figure 4: After maximum‑intensity projection
III. How the NCF1000 Confocal Microscope Supports the Experiment
1. Multicolor Scanning
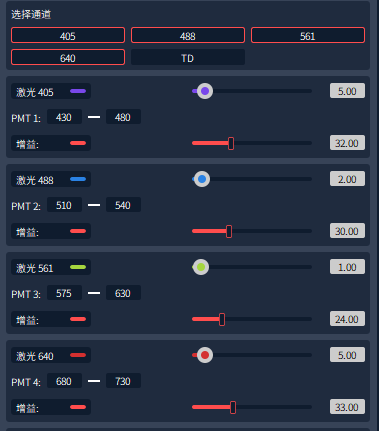
- The bundled NomisPro X‑C software supports multi‑laser‑channel acquisition.
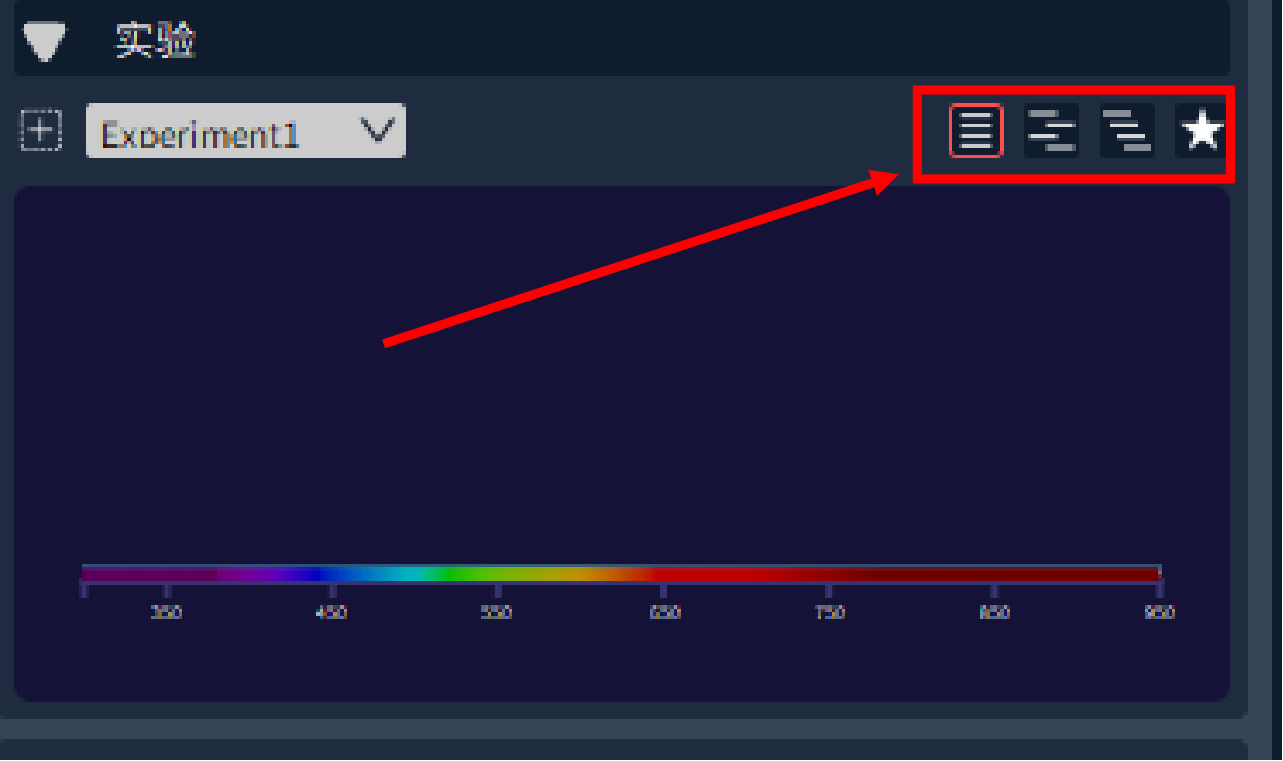
- Four scanning modes are available: 4‑channel simultaneous scanning, alternate‑channel scanning, time‑sequential scanning and custom‑defined scanning.
Figure 5: Laser channel selection panel
Figure 6: Different scanning modes
2. LUT Level Adjustment
- Levels can be tuned according to expression performance of fluorescent tags per channel. Both manual and auto level‑adjustment modes are provided.
Figure 7: LUT level adjustment interface
3. Maximum‑intensity Projection
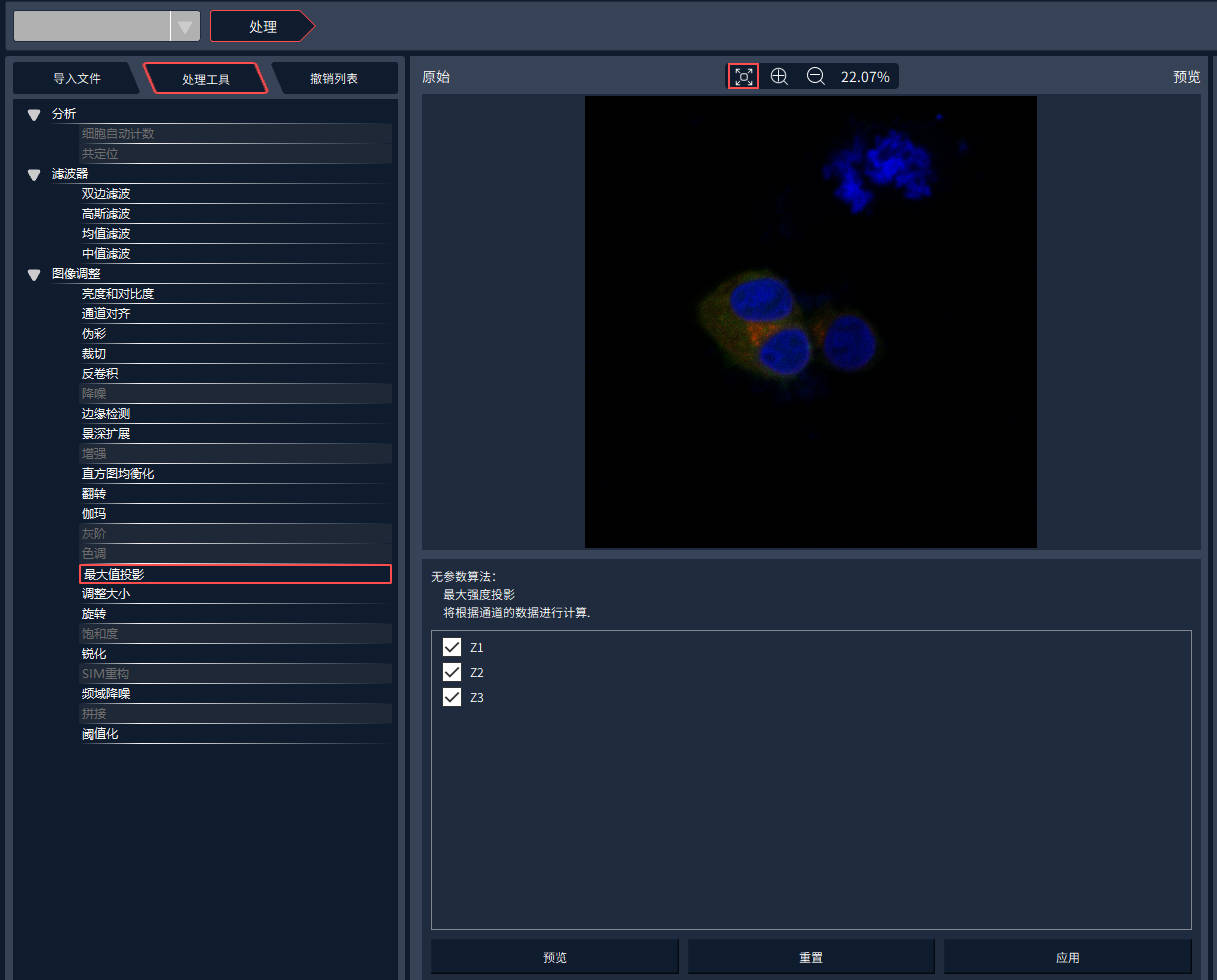
- Due to shallow confocal depth‑of‑field, cells may spread across multiple focal planes. Maximum‑intensity projection displays all fluorescent‑tag signals within one composite image.
- To enable this function, perform Z‑stack scanning first, then open the Z‑stack dataset in processing tools.
Figure 8: Maximum‑intensity projection operation interface
IV. Common Experimental Issues
Q1: Fluorescent‑protein signals are faint after transfection. Is re‑transfection required?
A1: NomisPro X‑C provides LUT level adjustment. Satisfactory imaging results can be obtained by tuning level values for low‑signal channels.
Q2: How to avoid crosstalk in multi‑channel fluorescence labelling assays?
A2: Four‑channel time‑sequential scanning suppresses crosstalk yet increases scanning duration. Alternate‑channel scanning balances low crosstalk and fast acquisition. For adjacent emission channels, use custom‑defined scanning to select target channels and scanning sequence manually.

 Products