I. Experimental Scenario: Precise 3D‑Structure Evaluation of SilMA Hydrogel Microneedles by Confocal Microscope
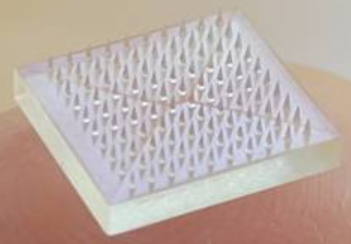
1. As an innovative transdermal drug‑delivery technology, microneedles show great application potential in vaccine delivery, cosmetic skincare, chronic‑disease treatment and other fields owing to their pain‑free, minimally‑invasive and high‑efficiency merits. An ideal microneedle should possess sufficient mechanical strength to penetrate the stratum corneum, together with favorable biocompatibility and tunable drug‑release performance.

Figure 1: Applications of microneedles
Figure 2: Schematic diagram of microneedle array
2. Methacrylated silk fibroin (SilMA) adopted in this study is an advanced photocrosslinkable hydrogel material. It inherits the intrinsic biocompatibility, degradability and mechanical properties of silk fibroin. With methacryloyl groups introduced, UV‑triggered controllable polymerization is realized, enabling precise fabrication of complex‑structured microneedles via micro‑molding.
3. Fine 3D architectures of transparent SilMA hydrogel can hardly be observed under bright‑field illumination. To evaluate overall morphology and structural integrity of microneedles, Rhodamine B was introduced as a fluorescent label. Its strong fluorescence signal enables high‑contrast 3D imaging of transparent hydrogel microneedles, providing critical evidence for material structural characterization.
4. In this experiment, 3D‑image acquisition and model rendering functions of NCF1000 laser confocal microscope were applied to precisely evaluate full 3D morphology of microneedles (e.g. tip sharpness, base flatness, structural integrity). A 10× objective and 561 nm high‑power excitation laser were mainly utilized.
II. User Application Results
- Precise 3D‑Structure Evaluation of SilMA Hydrogel Microneedles
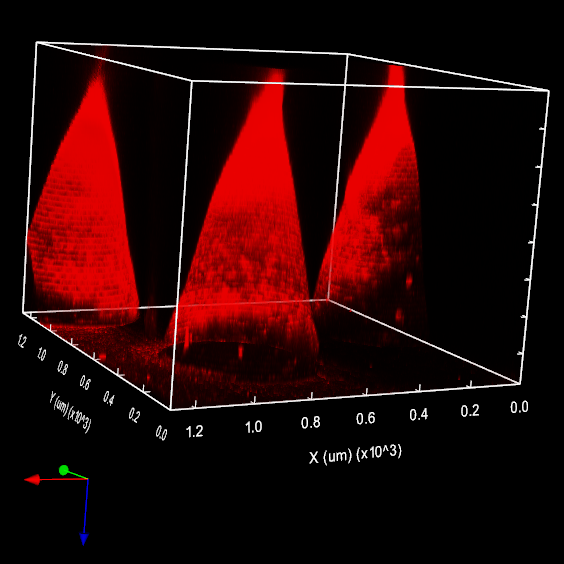
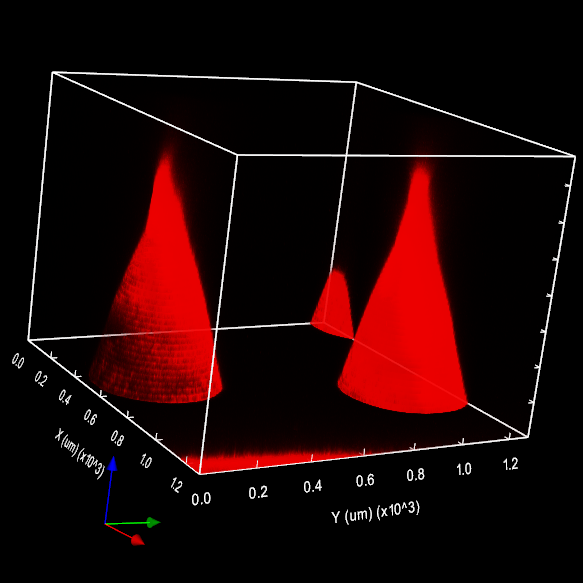
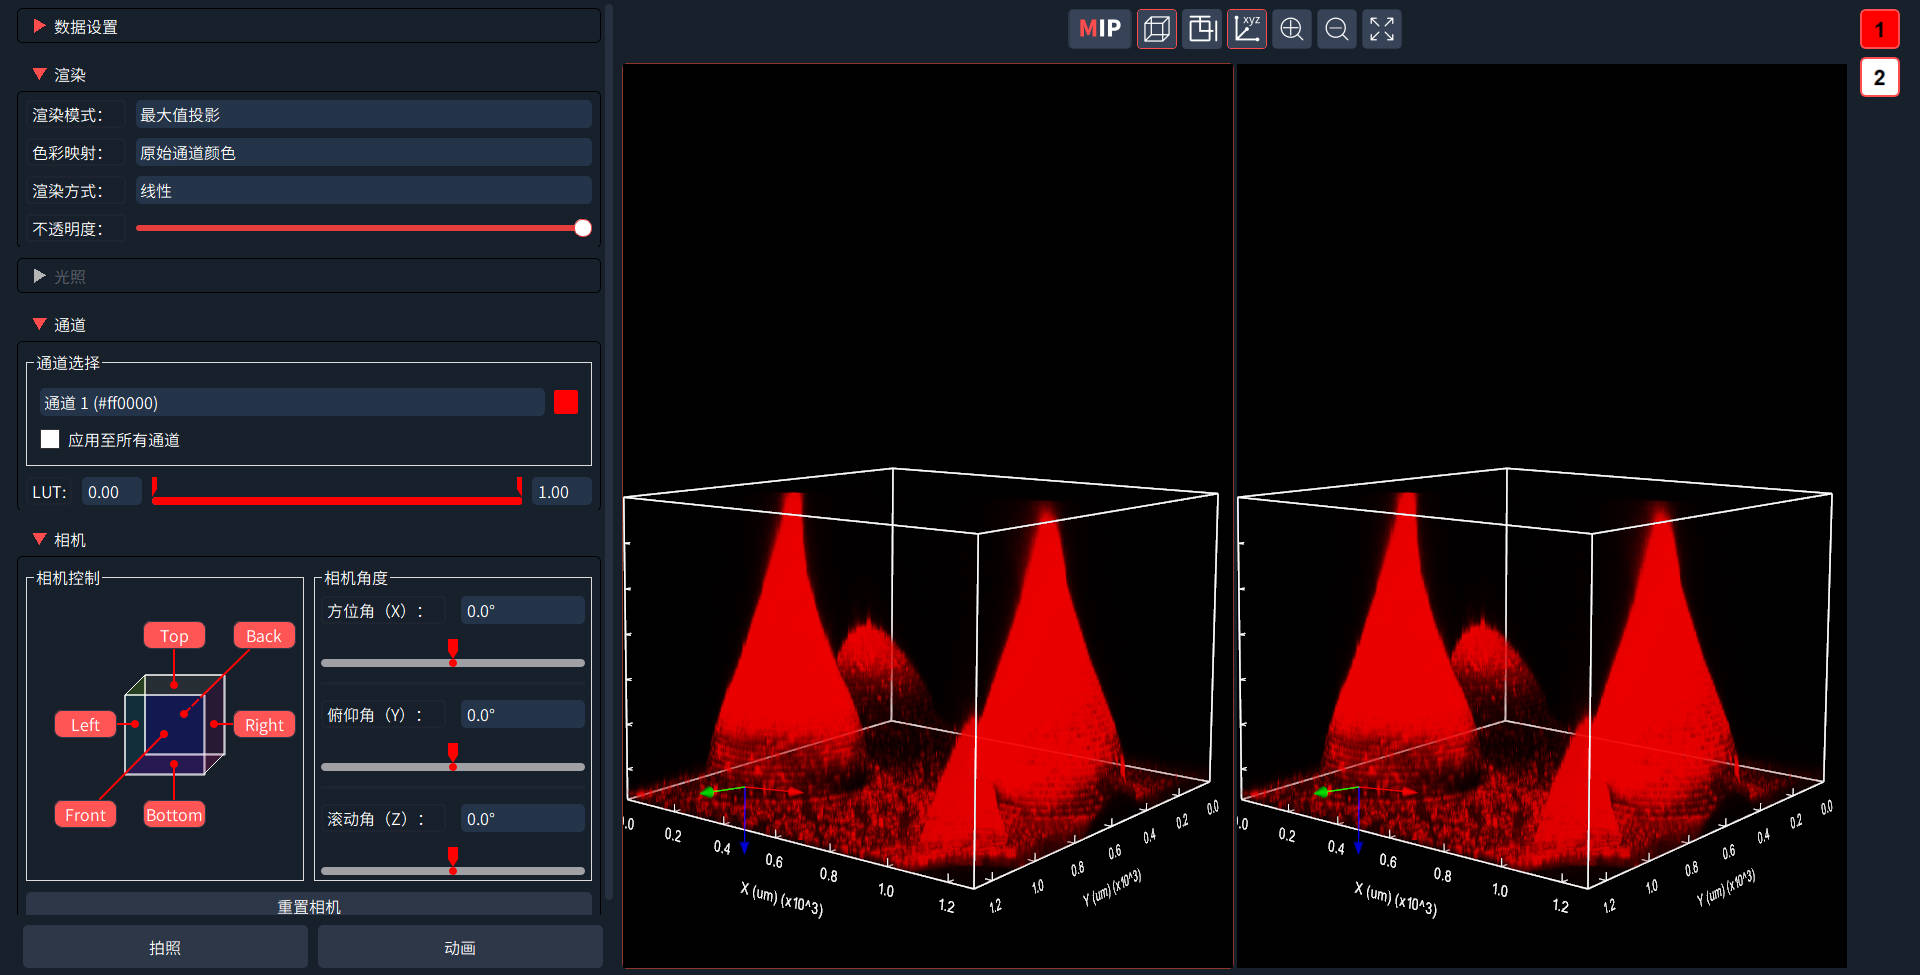
To acquire overall 3D spatial information of microneedles, the NCF1000 laser confocal microscope equipped with 10× (NA = 0.45) objective was used for Z‑stack acquisition and 3D‑model rendering across multiple fields‑of‑view of microneedle arrays (Figure 3, Figure 4).
Figure 3: 3D rendering of microneedles
Figure 4: 3D rendering of microneedles
III. How the NCF1000 Confocal Microscope Supports the Experiment
1. Z‑stack Image Acquisition
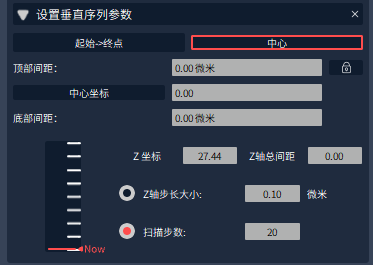
- Z‑stack datasets are applied for 3D imaging. Two Z‑stack modes are available: “Start/End” mode and “Center” mode. In “Start/End” mode, users define Z‑axis range for 3D imaging by setting upper and lower boundaries (Figure 5). In “Center” mode, imaging volume is determined by specifying the central Z‑position and desired 3D thickness (Figure 6). This function enables researchers to capture precise structural information in 3D space and improve imaging resolution and details.
- Z‑stack acquisition is supported by bundled NomisPro X‑C acquisition software or offline NomisPro X‑V software.
Figure 5: “Start‑End” mode
Figure 6: “Center” mode
2. 3D Visualization Function
- The 3D‑visualization function reconstructs 3D models from 2D Z‑stack slices via algorithms.
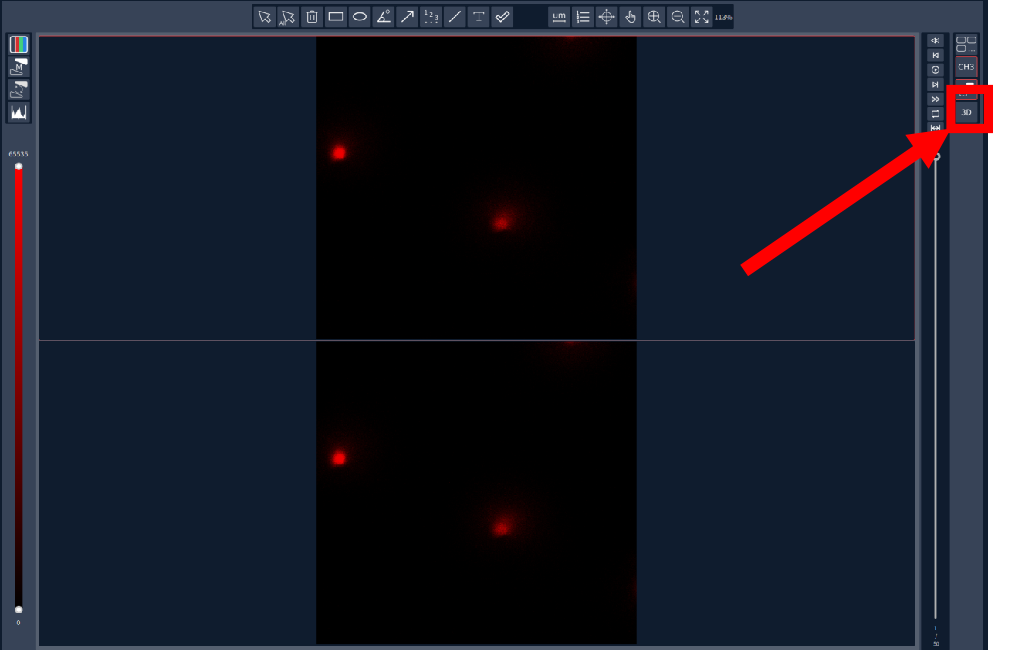
- Z‑stack files can be imported into NomisPro X‑C or offline NomisPro X‑V software. Model rendering and auto‑generated output are triggered by clicking the 3D‑image button (Figure 7).
- On the 3D‑visualization panel, level adjustment for individual 3D channels and multi‑angle display are accessible (Figure 8).
Figure 7: Entrance interface for 3D‑image visualization
Figure 8: 3D‑image display and adjustment interface
IV. Common Experimental Issues
Q1: Samples are solidified in liquid‑nitrogen environment. After taken out, prolonged experimental duration causes microneedle shrinkage and deformation, leading to distorted morphology. How to solve it?
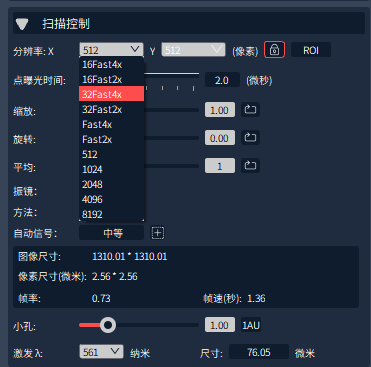
A1: The NCF1000 laser confocal microscope supports multiple imaging resolutions (Figure 9). Lower resolution delivers faster scanning. Balance resolution and acquisition time according to practical requirements.
Figure 9: Resolution selection panel
Q2: Stair‑like artifacts appear on reconstructed 3D models?
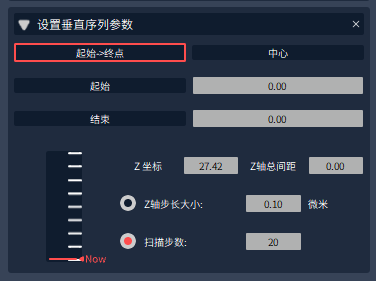
A2: Stair‑like artifacts mainly stem from improper Z‑step setting. Excessively large Z‑step causes insufficient axial sampling and loss of inter‑slice information. Configure proper Z‑step size or scan count within Z‑stack module.
Figure 10: Z‑stack step‑size setting panel

 Products